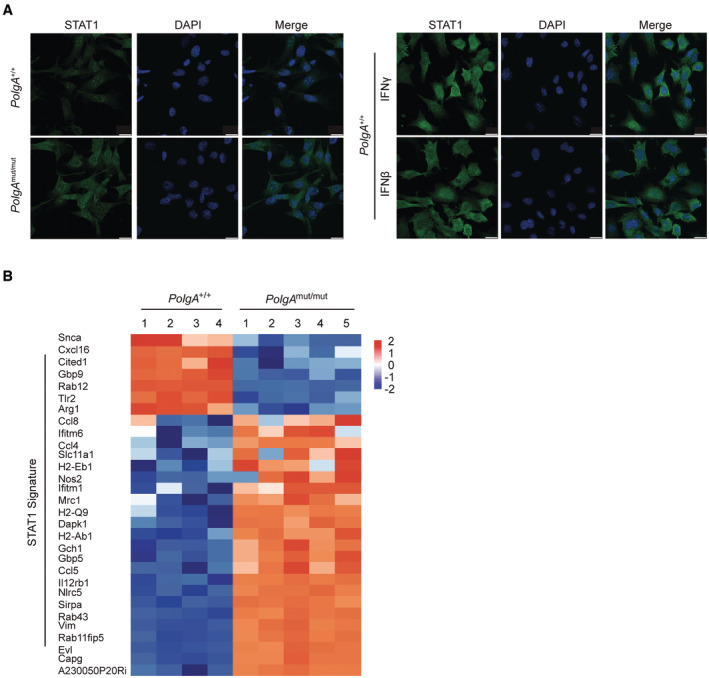
Figure EV2. Activation of STAT1 in PolgA mut/mut cells.

- Immunofluorescence analysis of STAT1 in PolgA +/+ and PolgA mut/mut cells, as well as in PolgA +/+ cells treated with 100 IU/ml IFNβ or 75 IU/ml IFNγ for 24 h, scale bar: 20 μm.
- Heatmap of mRNA expression values of significantly regulated STAT1‐stimulated genes obtained from RNA seq analysis of PolgA +/+ (four independent replicates of the same cell line) and PolgA mut/mut (five independent replicates of the same cell line) cells.
