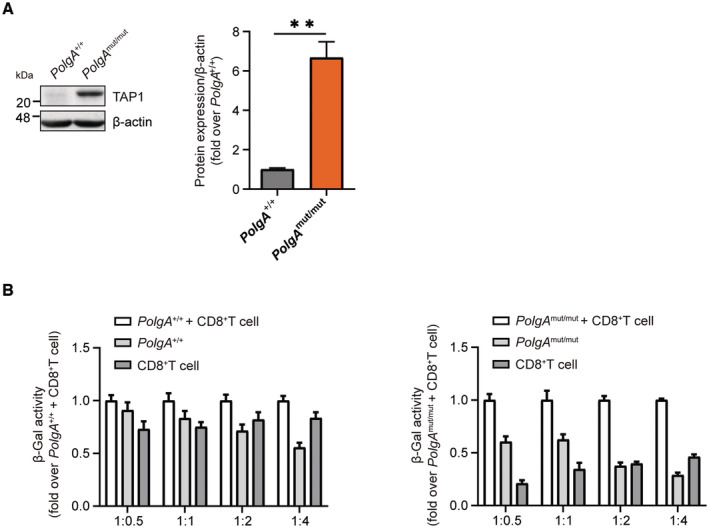
Figure EV4. TAP1 expression and CD8+ T‐cell reporter activation assay.

- Western blot analysis of TAP1 and β‐actin (loading control) and densitometric analysis from three PolgA +/+ and three PolgA mut/mut cell lines. Densitometric analysis shows mean ± SEM of three biological replicates and is presented as fold over mean of PolgA +/+ set to 1.
- CD8+ reporter T cell background in co‐culture with PolgA +/+ or PolgA mut/mut cells. Data are provided as normalized values to the β‐galactosidase (β‐Gal) activity of co‐cultured MEFs and CD8+ T reporter cells. Data show mean ± SEM of three independent biological experiments.
Data information: All data were analyzed with two‐tailed unpaired Student's t‐test. Asterisks indicate significance as **P < 0.01.
