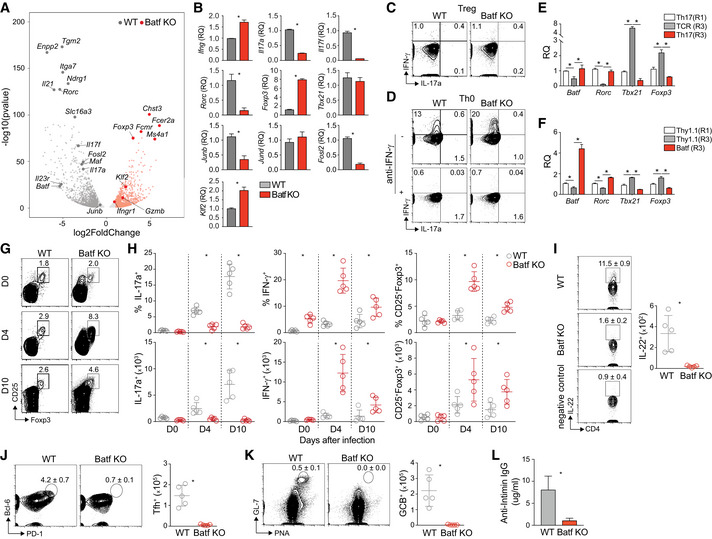
Figure EV1. Batf deficiency skews CD4 T cell development toward Th1/Treg phenotypes resulting in altered response to Citrobacter rodentium infection.

-
ANaïve WT and Batf KO CD4+CD62Lhi T cells were cultured under Th17‐polarizing conditions. On day 5, total RNA was extracted from resting Th17 cells and used for RNA‐seq. Differential gene expression (fold change > 2, fdr < 0.05) was represented as a volcano plot.
-
BNaïve WT and Batf KO CD4+CD62Lhi T cells were cultured under Th17‐polarizing conditions for 5 days. Total RNA was extracted from resting or restimulated (6 h with anti‐CD3) cells and used for gene expression analysis by RT–PCR (resting: Rorc, Foxp3, Tbx21, Junb, Jund, Fosl2, and Klf2; restimulated: Ifng, Il17a, and Il17f).
-
C, DDay 5 of differentiated WT and Batf KO cells cultured under Treg (C) or Th0 conditions (D, cultured with or without anti‐IFN‐γ) were restimulated with PMA and ionomycin for 5 h, and stained intracellularly for IFN‐γ and IL‐17a expression.
-
ENaïve CD4+CD62Lhi T cells from IL‐17a reporter mice (Il17a eGFP) were cultured under Th17‐polarizing conditions. On day 5, eGFP+/IL‐17a+ cells were sorted and cultured for two additional rounds in the presence of anti‐CD3 alone (TCR(R3)) or Th17‐polarizing cytokines (Th17(R3)). Cells from round 1 (Th17(R1)) and round 3 (TCR(R3) and Th17(R3)) were used for total RNA isolation to assess gene expression by RT–PCR (data normalized to Th17(R1)).
-
FNaïve CD4+CD62Lhi T cells from IL‐17a reporter mice (Il17a eGFP) were cultured under Th17‐polarizing conditions. On day 2, cells were transduced with control (Empty) or retrovirus expressing Batf‐Thy1.1 (Batf). eGFP+/IL‐17a+Thy1.1+ cells were sorted on day 5 and cultured for two additional rounds in the presence of anti‐CD3 alone. Thy1.1+ cells from round 1 (Thy1.1(R1)) and round 3 (Thy1.1(R3) and Batf(R3)) were used for total RNA isolation to assess gene expression by RT–PCR (data normalized to Thy1.1(R1)).
-
G, HWT and Batf KO mice were infected by gavage with 2 × 10⁹ cfu/ml Citrobacter rodentium (C.r.). Cells were isolated from the colon, restimulated with PMA and ionomycin, and stained intracellularly for flow cytometric analysis of cytokine production and Foxp3 (G) expression and were presented as percentages of the indicated cell population (H, top) and numbers of positive cells (H, bottom) at the indicated time points.
-
IMice were sacrificed on day 10 postinfection. Cells were isolated from the colon tissue, restimulated with PMA and ionomycin, and intracellularly stained for cytokine production. IL‐22‐producing CD4+ T cells on day 10 postinfection were assessed in the colon of infected WT and Batf KO mice with contour plots showing percentage ± s.e.m. and average of cell numbers. Data are gated on viable TCRβ+. Unstimulated cells were used as negative controls.
-
J–LCells from MLN of WT and Batf KO mice on day 10 postinfection were used for Tfh (CD4+CD44+CXCR5+PD‐1+Bcl6+) (J) and germinal center B cell (B220+PNA+GL‐7+) (K) staining with contour plots showing percentage ± s.e.m. and average of cell numbers. Anti‐Intimin IgG antibody was measured using serum of WT and Batf KO mice on day 21 postinfection (L).
Data information: Data are representative of two independent experiments with similar results (A) or mean ± s.e.m. of three independent experiments (B–F). (*P < 0.05; two‐sided t‐test). RQ, relative quantification. Data are gated on viable CD4+TCRβ+ and mean ± s.e.m. of n = 5 mice and representative of two independent experiments with similar results (G–L) (*P < 0.05; two‐sided t‐test).
