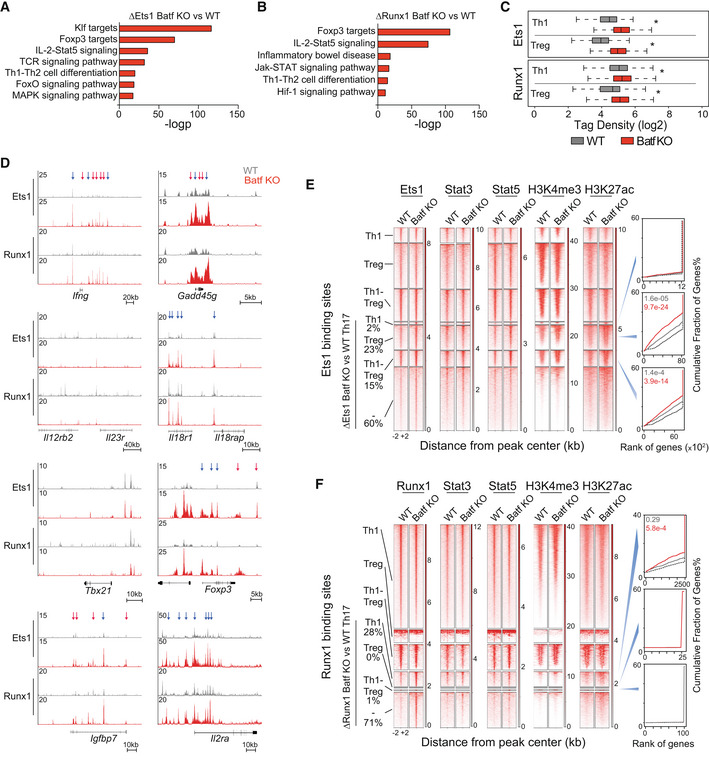
Figure 5. Functional cooperation between Ets1, Runx1, and Stat5 in regulating gene expression in Th17 cells.

-
A–F(A) Naïve WT and Batf KO CD4+CD62Lhi T cells were cultured under Th17‐polarizing conditions for 5 days and recovered to perform ChIP‐seq using antibodies to Batf, Ets1, Runx1, H3K4me3, H3K27me3, and H3K27ac. Stat3 and Stat5 ChIP‐seq were performed after IL‐6 and IL‐2 stimulation, respectively, using day 5 WT and Batf KO Th17 cells. WT Th1 or Treg cells were used to perform ChIP‐seq using antibodies to Ets1 and Runx1. Differentially enriched Ets1 and Runx1 peaks in Batf KO vs. WT Th17‐polarized cells (ΔEts1 Batf KO vs. WT, ΔRunx1 Batf KO vs. WT) were used for genomic annotation analysis (A, B). Boxplots show normalized tag density of Ets1 and Runx1 surrounding ±1 kb of peak centers, annotated to the nearest Th1‐ and Treg‐specific genes comparing WT and Batf KO Th17‐polarized cells. Central bands, boxes, and whiskers represent the median, upper quartile, and lower quartile and maximum and minimum values, respectively (C). Tracks show Ets1 and Runx1 ChIP‐seq data from WT and Batf KO Th17‐polarized cells at the indicated gene loci (D; WT, gray; Batf KO, red). Arrows indicate differential Ets1 and Runx1 binding with (red) or without (blue) the presence of Batf binding comparing WT and Batf KO cells. Ets1 (E) or Runx1 (F) peaks from WT Th1, Treg, or both (Th1‐Treg) were integrated with enriched Ets1 or Runx1 peaks in Batf KO compared with WT Th17 cells (Fig 4C) to separate peaks into unique and overlapping clusters. Heatmaps show Stat3, Stat5, H3K4me3, H3K27ac, Ets1 (E), and Runx1 (F) occupying ±2 kb of peak centers of Ets1‐ (E) or Runx1‐bound (F) sites in WT Th1, Treg, or both (Th1‐Treg) that overlap with uniquely enriched Ets1‐ (E) or Runx1‐ bound (F) sites from Batf KO compared with WT Th17 cells (Fig 4C—ΔEts1 Batf KO vs. WT, E; ΔRunx1 Batf KO vs. WT, F) along with the percentage of co‐bound and unique peaks. Histograms represent a rank of genes based on the regulatory potential score of Ets1 (E, right panels) or Runx1 (F, right panels) binding from each cluster to the differentially expressed genes in WT (gray) vs. Batf KO (red) Th17‐polarized cells derived from the integration of ChIP‐seq and RNA‐seq data using BETA algorithm.
Data information: Data are representative of two independent experiments with similar results. *P < 0.05 (Mann–Whitney test).
