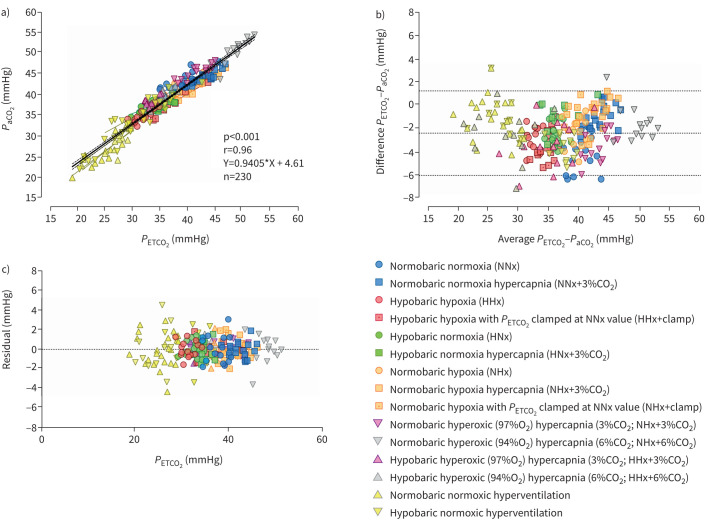
FIGURE 1.
Pooled correlation and linear regression analyses of a) end-tidal carbon dioxide tension (PETCO2) versus arterial carbon dioxide tension (PaCO2) measured during 17 experimental conditions and b) Bland–Altman plot of the actual difference versus the mean of PETCO2 and PaCO2; c) the residuals plot. In b) dotted lines represent the bias and the 95% confidence intervals. CO2: carbon dioxide; O2: oxygen.

