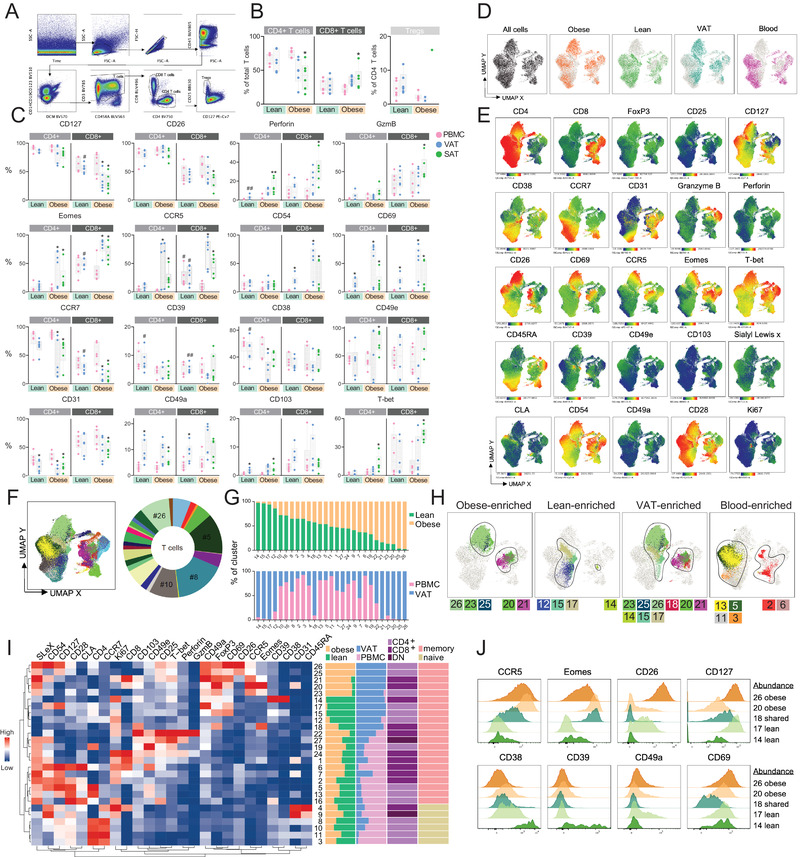
Figure 2.

High dimensional profiling of T cell subsets in adipose tissue associated with obesity (A) Gating strategy to identify T cell subsets. Plots showing one representative visceral adipose tissue (VAT) sample. (B) Percentages of CD4+ and CD8+ T cells out of total, live T cells and Tregs out of CD4+ T cells in peripheral blood (PBMC) and VAT of lean subjects (n = 6) and PBMC, VAT and subcutaneous adipose tissue (SAT) of individuals with obesity (n = 6). (C) Box‐and‐whisker plots showing percentage of CD4+ and CD8+ T cells expressing the indicated proteins in blood and adipose tissue from the same individuals. Line represents median and whiskers represent min and max value. The Wilcoxon matched‐paired sign rank test was used for comparison between paired samples and The Mann‐Whitney U test was used for comparison between the lean subjects and individuals with obesity. (*) indicates significant difference between blood and adipose tissue in the same patient group, and (#) indicates significant difference between lean and obese for the indicated tissue compartment. */# p < 0.05, **/## p < 0.01. (D) UMAP plot of T cells. CD3+ T cells from VAT and blood from lean subjects and individuals with obesity were gated, barcoded, and down sampled. Colors indicate the origin of cells. (E) UMAP plots showing expression intensities of 25 phenotypic markers. (F) Twenty‐seven identified PhenoGraph clusters and donut plot visualizing the fractions of each cluster out of the total T cell population. (G) Stacked bars showing proportions of lean‐ and obese‐derived (top) and blood‐ and VAT‐derived (bottom) T cells within each cluster. (H) Selected PhenoGraph clusters displayed over UMAP embeddings showing obese‐, lean‐, VAT‐, and blood‐enriched clusters. (I) Heatmap displaying Z‐score transformed median fluorescence intensity (MFI) expression values for each of the proteins within the 27 clusters. Color scale is determined for each column separately, based on the lowest and highest Z‐score value for that protein. The heatmap was clustered using the ward.D cluster method. Lineage marker annotations are based on expression of CD4, CD8 or double negative (DN), CCR7, and CD45RA (J) Representative histograms showing modal expression intensities of indicated proteins in clusters that are obesity‐enriched (#26 and #20), shared (#18) or lean‐enriched (#14, #17).
