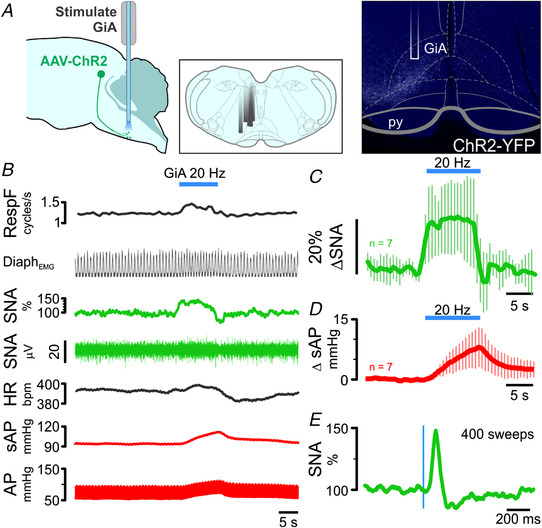
Figure 6. Respiratory and cardiovascular responses to optogenetic stimulation of cl‐dSC‐GiA terminals under urethane anaesthesia.

A, illustration of (L–R) experimental strategy, locations of optical fibres in different experiments and a histological specimen illustrating fibre position and terminal ChR2 labelling. B, physiological recording of respiratory, sympathetic and cardiovascular responses to GiA stimulation; pooled sympathetic and pressor responses from seven experiments are shown in C and D. E, stimulus‐triggered average of sympathetic response to 0.5 Hz stimulation from the experiment shown in B. [Colour figure can be viewed at wileyonlinelibrary.com]
