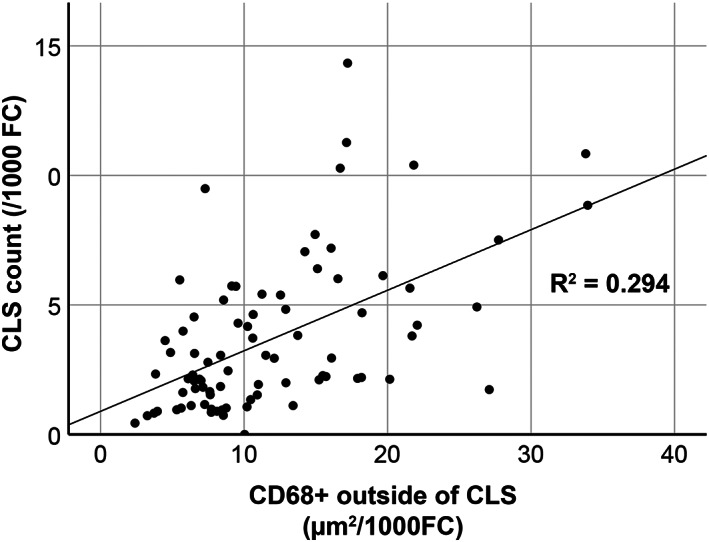
FIGURE 2.

Scatterplot showing correlation of total crown‐like structure (CLS) density (CLS/1000 fat cells [FC]) and dispersed CD68‐positive cells outside CLSs (area of CD68 expression/1000 FC) in subcutaneous adipose tissue samples of subjects with obesity taken before intervention. Correlation is significant (bivariate analysis; ρ = 0.53, p < 0.001, R 2 = 0.294)
