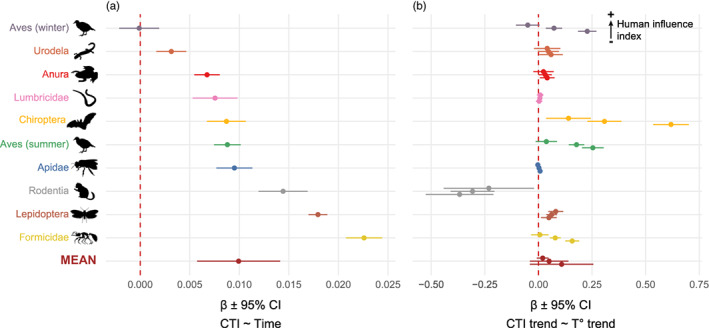
FIGURE 3.

Community response to climate change for each taxon. Slopes and 95% confidence intervals of the relationship between (a) community temperature index (CTI) and time (i.e. 5‐year periods), (b) local CTI trend and local temperature trend, shown for three levels of human influence index (25th percentile, median, and 75th percentile of values, from bottom to top). The brown dots at the bottom represent the meta‐analytical mean responses across all taxa.
