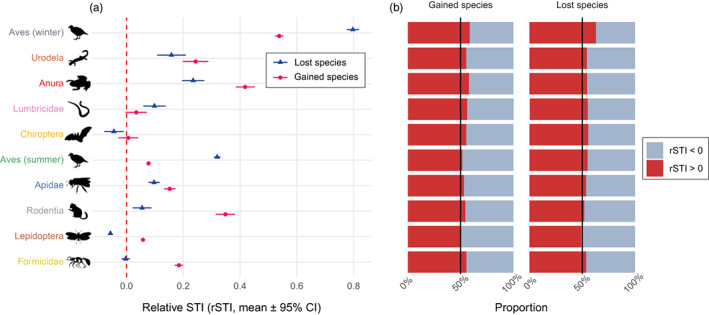
FIGURE 4.

(a) Mean relative species temperature index (rSTI) of species lost (dark blue triangles) and gained (pink dots) between each time period. (b) Proportion of gained and lost species that had positive (red) or negative (blue) rSTI. For a given species, its rSTI represents the difference between the STI and the community temperature index of the assemblage it colonizes or from which it is extirpated, therefore reflecting whether it is locally warm (rSTI > 0) or cold (rSTI < 0) adapted.
