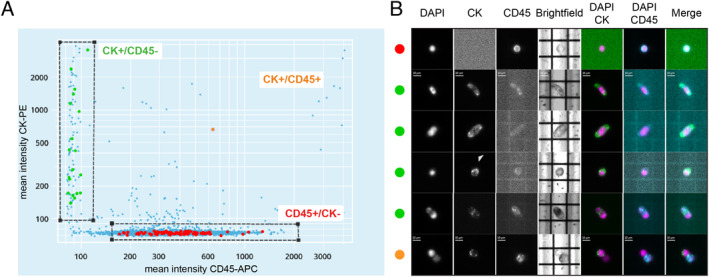
FIGURE 1.

Single‐trophoblast selection and immunophenotypic staining. (A) Scatter plots of pan‐cytokeratin–phycoerythrin (CK‐PE) mean intensity (y axis) versus CD45–allophycocyanin (APC) mean intensity (x axis) of putative circulating extravillous trophoblasts (cEVTs) (CK+/CD45− cells), white blood cells (WBCs) (CK−/CD45+ cells) and a mixed cell (CK+/CD45+). Selected WBCs, cEVTs and mixed cells are highlighted in red, green and orange, respectively. (B) Image gallery of one representative WBC (side red dot), four representative cEVTs (side green dots) and a representative mixed cell (side orange dot); DAPI (4',6‐diamidino‐2‐phenylindole), CK, CD45 and brightfield single channels are visualized in grayscale; DAPI/CK, DAPI/CD45 and Merge combined channels are visualized as follows: DAPI signal in purple, CK signal in green and CD45 signal in cyan. The four representative cEVTs exhibit different typical morphological features from top to bottom: elongated cells with cytoplasmic processes, cells with an even distribution of cytoplasmic cytokeratin, so‐called “bubble” cells with cytokeratin high‐density spots (arrowhead) and CK+/CK+ doublets. Scale bars: 10 μm.
