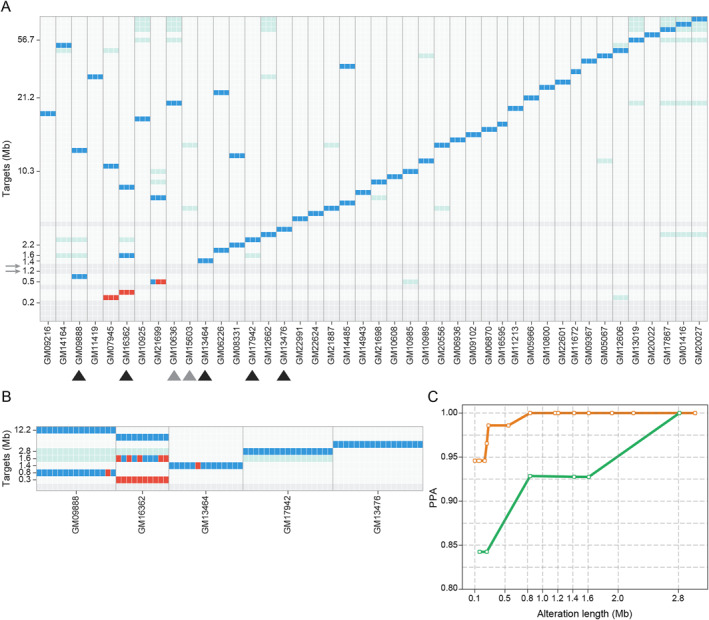
FIGURE 3.

Copy number variant (CNV) limit of detection (LoD) experiments. (A) The Coriell targets have been arranged on the y axis in the ascending order according to their size, while the cell line samples (genomic DNA (gDNA))—3 replicates per cell line—have been ordered on the x axis according to the size of the targets expected in the cell line itself. Each squared cell represents the detection status of the single target in a single replicate with analytical true positives in blue (the copy‐number value for the x cell line in the y target matches the expected altered copy‐number), analytical false negatives in red (the copy‐number value for the x cell line in the y target does not match the expected altered copy‐number) and true negatives in light grey (the copy‐number value for the x cell line in the y target matches the expected normal value). Dark grey and light‐green boxes show, respectively, “no call” targets, characterized by a poor copy‐number signal, and “no eval” targets, in cell lines that harbor overlapping targets. (B) Single cells isolated from a subset of Coriell cell lines, chosen based on target size close to 1Mb, were assessed to confirm the resolution determined with gDNA using samples that simulate real cases (cell lines used are indicated by black arrowheads in panel A). (C) Trend of analytical sensitivity (Positive Percent Agreement (PPA)) according to increasing target length measured on the data described in panels A (orange line) and B (green line).
