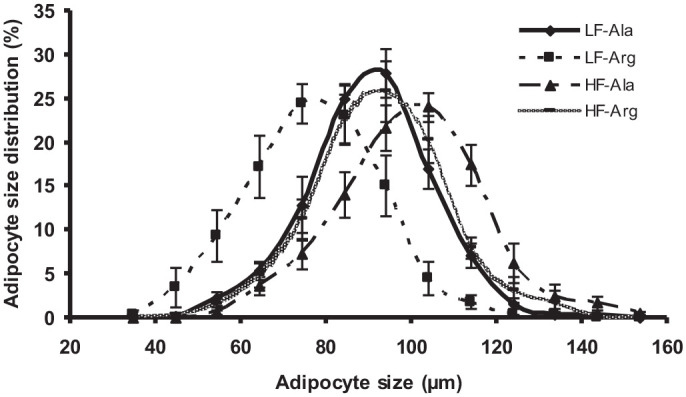
Figure 2.

Size distribution of adipocyte from retroperitoneal (RP) adipose tissue of rats. Between 4 and 19 weeks of age, rats were fed low- and high-fat diets, respectively. Thereafter, rats in each dietary group received drinking water containing either 1.51% l-arginine·HCl or 2.55% l-alanine (isonitrogenous control) for 12 weeks. At the end of the feeding experiment, RP adipose tissue was dissected, adipocytes were isolated using an enzymatic method, and their sizes were determined under a microscope. Data are expressed as means ± SEM (n = 8/treatment group). P values for diet effect, AA effect, and their interaction are summarized below:
