
Figure 5:
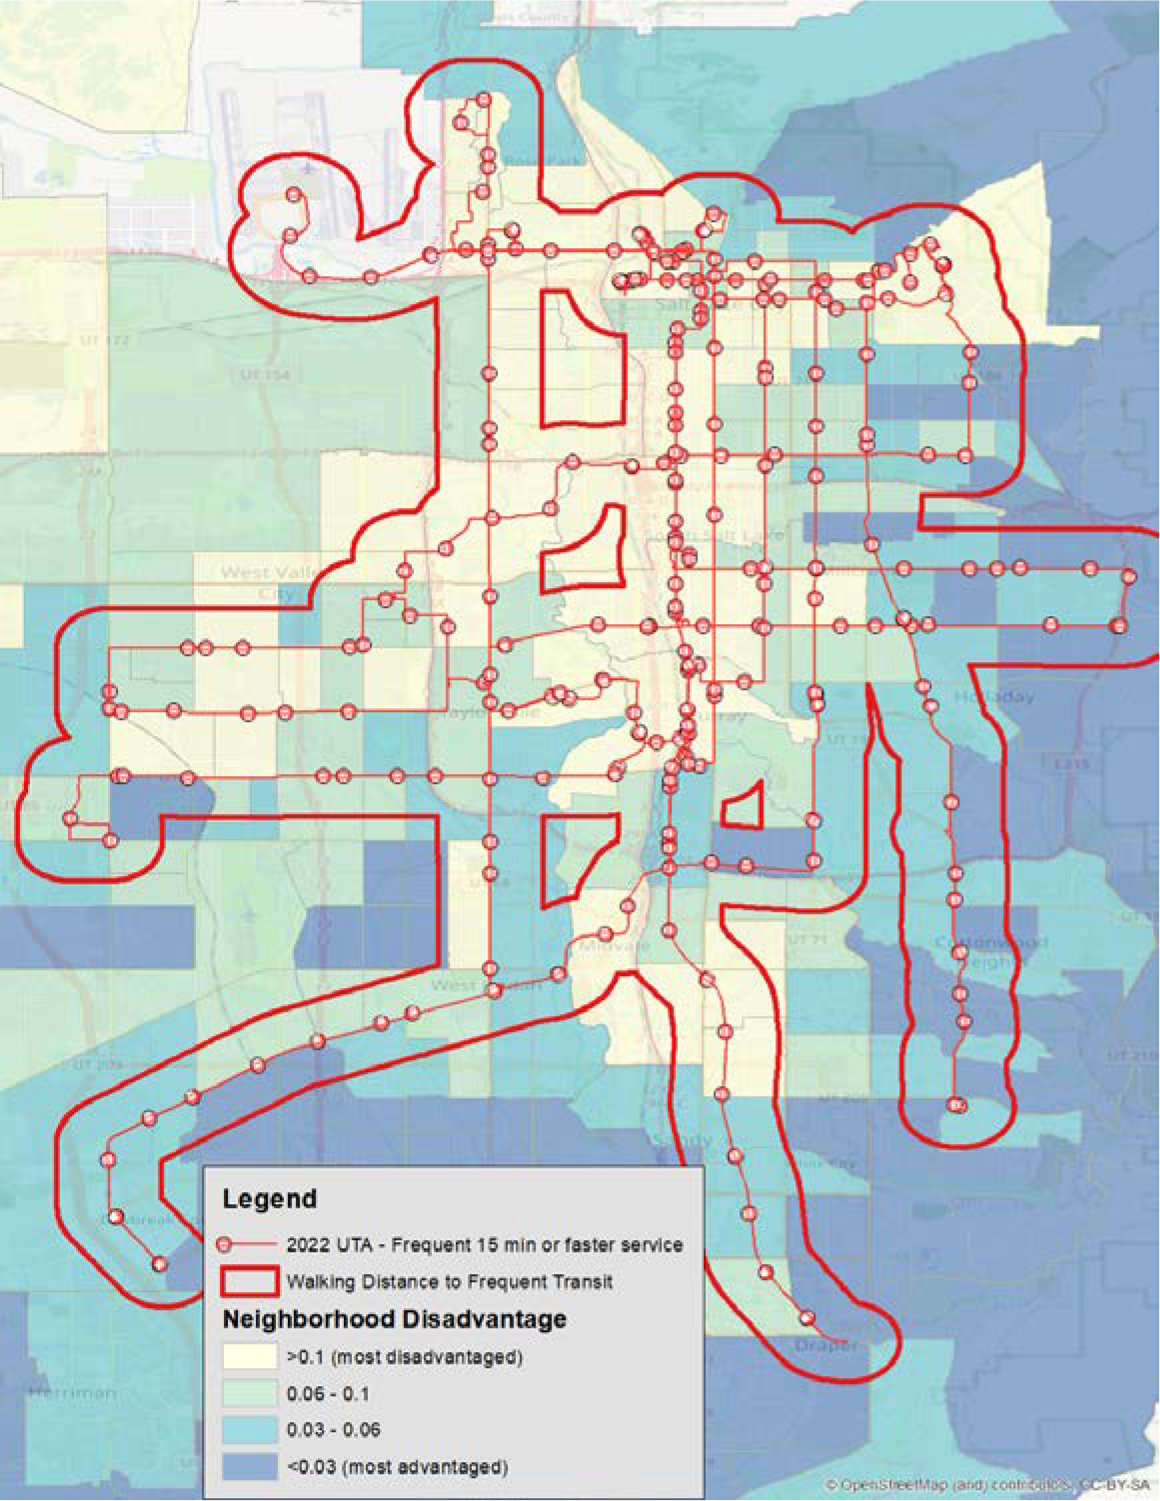
Neighborhood disadvantage and access to public transport
The hatched area represents a less than 15-minute walking distance to frequent transit lines, which is overlayed on the NSD score. Notably, the use of transit frequency is better able to elucidate neighborhood stress and obstacles to care compared with a raw count of transit stops available. Gaps in coverage can be seen on the western side of Salt Lake County as well as central areas bordering highways.