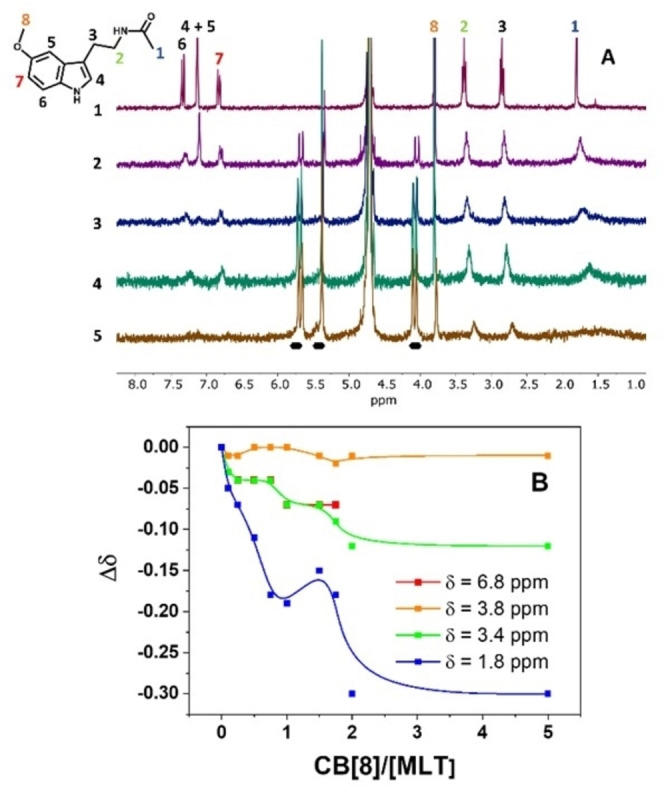
Figure 1.

NMR results of the complex CB[8] with MLT. A) 1H NMR spectra obtained from titration experiments of 2.0 mM MLT (spectrum 1, signal assignment in MLT structure) with CB[8] (0.10–5.0 equiv, from 2 to 5) in D2O. The CB[8] proton signals are indicated in the figure by black marks. B) Fitting of selected protons shift change with CB[8] concentration.
