Fig. 4.

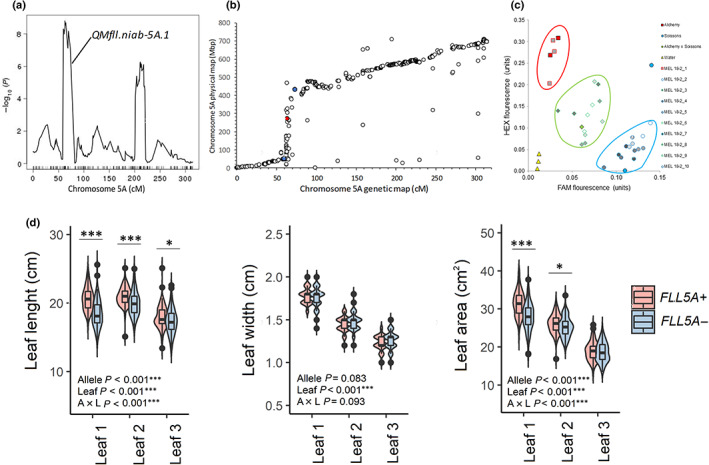
Development and assessment of a near‐isogenic line (NIL) pair for QTL QFll.niab‐5A.1. (a) Results of meta‐QTL analysis for flag leaf length using genetic analysis method CIM‐cov10, showing chromosome 5A QTL QFll.niab‐5A.1. (b) Comparison of genetic (Gardner et al., 2016) vs physical (IWGSC et al., 2018) maps shows the QTL interval is in the region of low genetic recombination spanning the chromosome 5A centromere. The QFll.niab‐5A.1 peak marker is shown in red, and the left and right flanking markers are shown in blue. (c) The use of a codominant Kompetitive Allele‐Specific PCR marker for single‐nucleotide polymorphism (SNP) BS00062996_51 to screen 10 F5 sibling individuals from MAGIC recombinant inbred line (RIL) MEL_018_2. This RIL was heterozygous across QFll.niab‐5A.1, with alleles from the founders Alchemy (HEX, SNP = T:T) and Claire (FAM, SNP = C:C) predicted by CIM genetic analysis to confer long and short alleles at QFll.niab‐5A.1, respectively. Shown are the results using template DNA from Alchemy, Claire, a 50 : 50 mix of Alchemy : Claire to create an artificial heterozygote, 10 F5 individuals of RIL MEL_018_2, and a negative water control. Selection of F5 individuals MEL_018_2_1 (Alchemy allele) and MEL_018_2_2 (Claire allele) established the QFll.niab‐5A.1 NIL pair. (d) Subsequently, this NIL pair (FLL5A+ and FLL5A−) was grown at five field trials (sites NIAB 2019, KWS 2020, NIAB 2020 and LIM 2020) and two glasshouse experiments (GH 2019 and GH 2021), where the first (flag), second and third leaves were phenotyped for length and width, and area calculated. Shown here are data for trial LIM 2021; data for all trials are shown in Fig. S4. Significant differences between each NIL line for flag leaf, leaf‐2 or leaf‐3 indicated as *, P < 0.05; **, P < 0.01; ***, P < 0.001, as assessed by one‐way ANOVA. Also indicated within each panel are P‐values for interallelic (A), interleaf (L) and allele × leaf interaction (A × L), as assessed by two‐way ANOVA. For the boxplots, vertical lines denote the median, boxes indicate the lower (25%) and upper (75%) quartiles, whiskers indicate the ranges of the minimum and maximum values, and dots predicted outliers.
