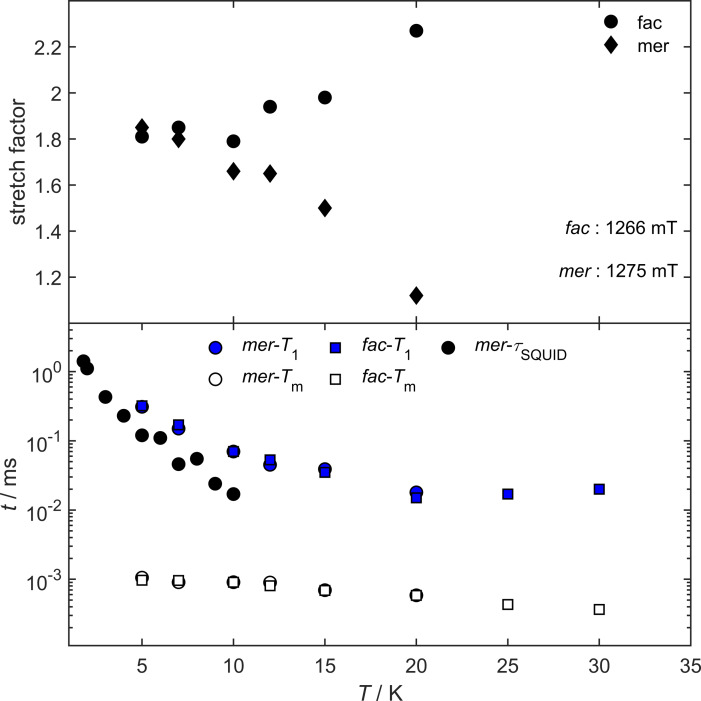
Figure 7.
Bottom: T 1 (blue filled symbols) and T M (non‐colored symbols) of cis‐fac‐[V(ddpd)2][BPh4]2 (squares) and mer‐[V(ddpd)2][BPh4]2 (circles), measured at 1266 mT and 1275 mT, respectively. As black circles relaxation times, obtained by AC susceptometry for mer‐[V(ddpd)2][BPh4]2. Top: Stretch factors of the corresponding fits of the echo‐decay curves based on Equation (2).

