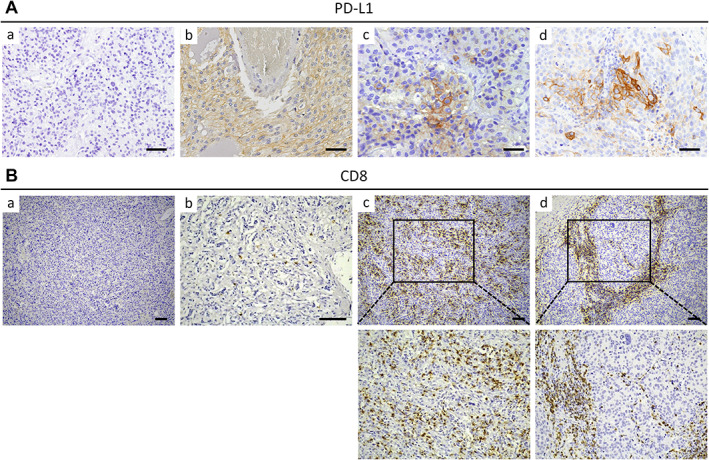
Figure 1.

PD‐L1 and CTL expression in PPGL. (A) Representative images of PD‐L1 immunohistochemistry performed in PPGL showing absence (a) or presence of homogenously (b) or focally (c and d) distributed staining of PD‐L1. Positive immunostaining is localized at plasma membrane and cytoplasm of tumor cells. Scale bars, 50 μm. (B) Representative images of CD8 immunohistochemistry performed in PPGL showing tumors with cold (a and b), hot (c), or immune‐excluded (d) phenotypes. Images below (c) and (d) are magnified pictures of the areas outlined in (c) and (d), respectively. Scale bars, 100 μm.
