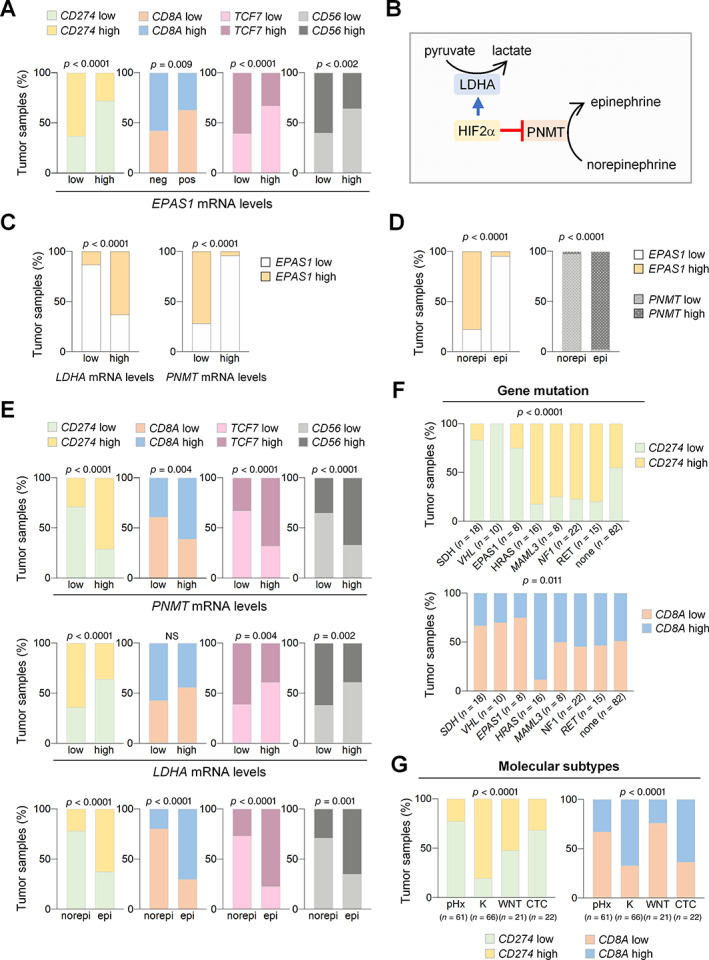
Figure 6.

Validation and extended data using RNAseq data of PPGL included in TCGA database. (A) Bart charts showing relationship of CD274, CD8A, TCF7, and CD56 with EPAS1 mRNA levels. (B) Diagram showing HIF2α‐mediated positive and negative regulation of LDHA (catalyzing conversion of pyruvate to lactate) and PNMT (catalyzing conversion of norepinephrine to epinephrine), respectively. (C) Bart charts showing relationships between EPAS1 and LDHA or PNMT mRNA levels. (D) Bart charts showing relationships between mRNA levels of EPAS1 and norepinephrine (norepi) or epinephrine (epi) secretory phenotype of tumors. (E) Bart charts showing relationships between CD274, CD8A, TCF7, and CD56 with PNMT and LDHA mRNA levels or secretory phenotype (norepi or epi) of tumors. (F and G) Bart charts showing CD274, CD8A mRNA levels in (F) tumors harboring mutations in indicated genes or (G) in tumors belonging to indicated molecular subtypes (pHx: pseudohypoxia; K: kinase‐related subtype; WNT: Wnt‐altered subtype; CTC: cortical admix subtype). Total number of tumors in each group is indicated in parentheses.
