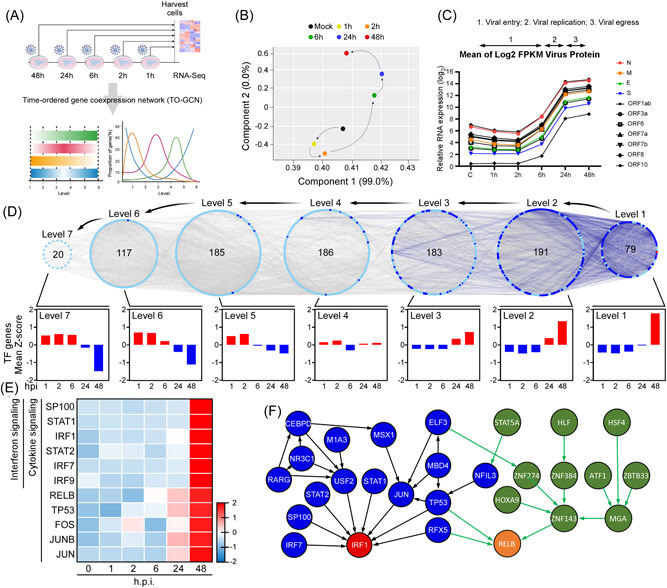
Figure 1.

Reverse time‐ordered gene coexpression network (TO‐GCN) revealed IRF1‐ and RELB‐mediated activation of interferons and cytokines signaling. (A) Schematic flowchart of RNA‐sequencing analysis. (B) Principal‐component analysis of RNA‐sequencing results of indicated viral infection time. (C) Expression profiles of viral protein‐coding genes. (D) Reverse TO‐GCN of expressed transcription factor (TF) genes. Each node and edge represent a TF gene and the coexpression relationship between two TF genes, respectively. The numbers in the center of the level represent the number of TF genes in the level. The diagrams of average Z‐scores for TF genes in each level were displayed at the bottom of the figure. (E) Heatmap for expression profiles of TF genes involved in interferon (top six genes) or cytokine signaling pathways. (F) The network analysis for TFs based on TO‐GCN of expressed TF genes. IRF1, interferon regulatory factor 1.
