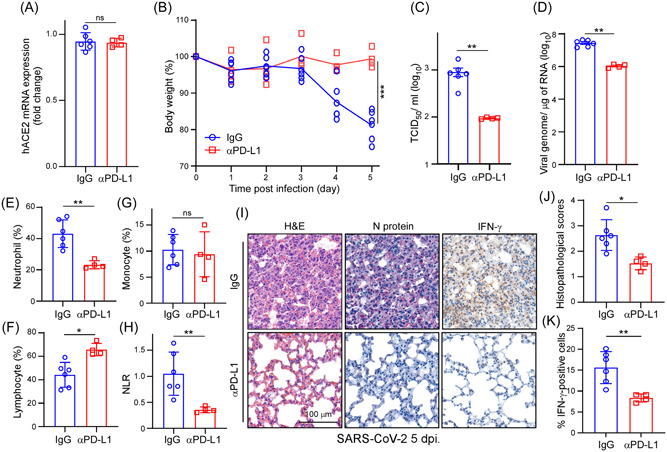
Figure 5.

Blockage of PD‐L1 recovers the severity of mice. (A) RT‐qPCR analysis of hACE2 mRNA expression in lung tissues of SARS‐CoV‐2 infected AAV‐hACE2 mice treated with IgG (n = 6) or anti‐PD‐L1 antibody (n = 4). (B) The weight loss curve of AAV‐hACE2 mice infected with SARS‐CoV‐2 (n = 6). Statistic method: Mann–Whitney U test, ***p < 0.001. (C) Tissue culture infection dose 50% (TCID50) was determined in the IgG or anti‐PD‐L1 antibody treatment AAV‐hACE2 mice lung tissues. Results are mean values ± SD of three independent experiments (n = 6 with mean ± SD shown). Statistic method: Mann–Whitney U test, **p < 0.01. (D) RT‐qPCR was performed to analyze viral RNA expression in lung tissues of SARS‐CoV‐2 infected AAV‐hACE2 mice treated with IgG or anti‐PD‐L1 antibody (n = 6). Statistic method: Mann–Whitney U test, **p < 0.01. (E–H) The percentage of neutrophils, lymphocytes, monocytes, and NLR (neutrophil‐to‐lymphocytes ratio) in the peripheral blood of SARS‐CoV‐2 infected AAV‐hACE2 mice treated with IgG or anti‐PD‐L1 antibody (n = 6). *p < 0.05, **p < 0.01. (I) Representative microscopic images of N protein and IFN‐γ expression in lung tissues of SARS‐CoV‐2 infected AAV‐hACE2 mice. Scale bar = 100 µm. (J) Histopathology score of AAV‐hACE2 mouse lungs after SARS‐CoV‐2 infection. (n = 6). *p < 0.05. (K) Quantification of the percentage of IFN‐γ‐positive cells in the lung tissue of SARS‐CoV‐2‐infected AAV‐hACE2 mice treated with IgG or anti‐PD‐L1 antibody. **p < 0.01, (n = 6). AAV‐hACE2, adeno associated virus‐human angiotensin‐converting enzyme 2; IFN‐γ, interferon‐γ; mRNA, messenger RNA; PD‐L1, programmed death ligand‐1; SARS‐CoV‐2, severe acute respiratory syndrome coronavirus 2; RT‐qPCR, real‐time quantitative polymerase chain reaction.
