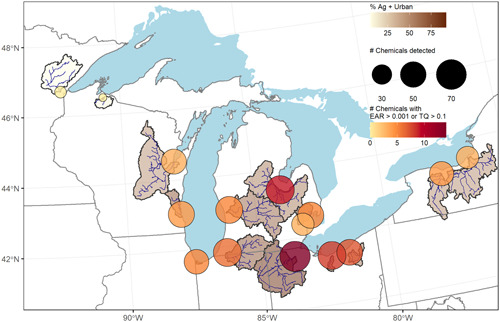
Figure 1.

Chemical detections and exposure activity ratios (EARs) and/or toxicity quotients (TQs) for pesticides and pesticide transformation products measured in passive samplers collected from 15 Great Lakes tributaries, June–July 2016. Symbol size represents the number of chemicals detected per site and color represents the number of chemicals exceeding an EAR threshold of 10–3 or a TQ threshold of 0.1. Watershed fill color represents the percentage area classified as agriculture and urban.
