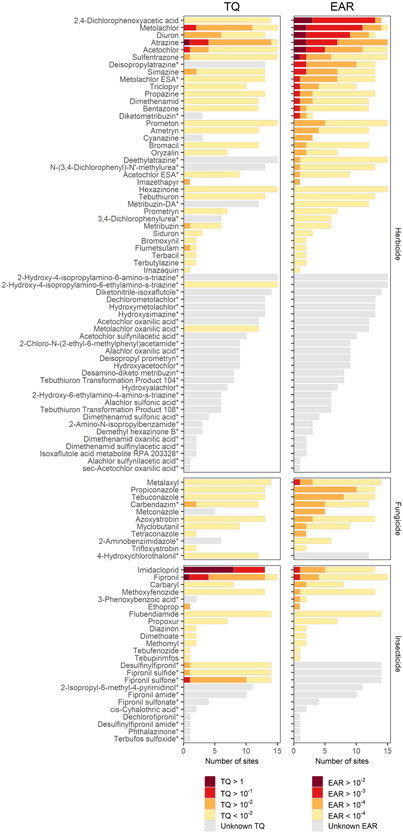
Figure 2.

Pesticide and pesticide transformation product (designated with*) detections (yellow/gray) and potential activity (red/orange) based on toxicity quotients (TQs; left) and exposure activity ratios (EARs; right) from passive sampler monitoring results in 15 Great Lakes tributaries, June–July 2016. The combined length of each bar represents the number of sites where a chemical was detected above the minimum detection limit. Red, orange, and yellow show the number of sites where a chemical exceeded TQ or EAR values. Chemicals with gray bars lacked information for evaluation of TQ or EAR. Chemicals are grouped by intended use and ordered by frequency of elevated EAR values.
