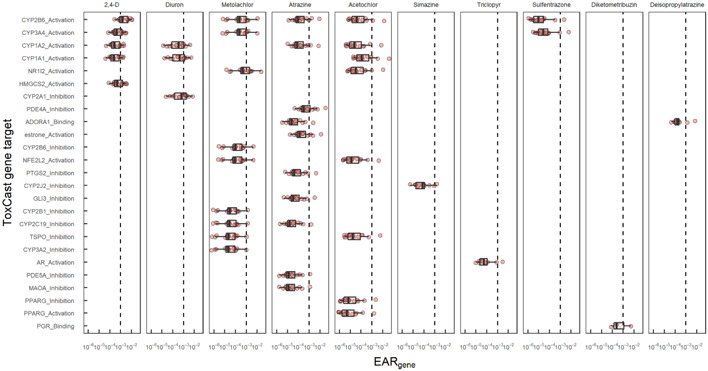
Figure 5.

Exposure activity ratios (EARs) by site across chemicals and ToxCast assay endpoint gene targets for pesticides and pesticide transformation products detected in passive samplers from 15 Great Lakes tributaries, June–July 2016. Chemicals represent those that had an EAR exceeding the threshold of 10–3 for at least one endpoint in at least one site. Boxes were only plotted for combinations of chemicals and genes that exceeded the EAR threshold in at least one site. Each boxplot shows the distribution of EARs among sites and endpoints. The upper and lower edges are the 25th and 75th percentiles, and whiskers are drawn up to 1.5 times the interquartile range. Scanning the figure vertically highlights the specific genes linked to a chemical individually and scanning horizontally highlights the multiple chemicals associated with a given gene.
