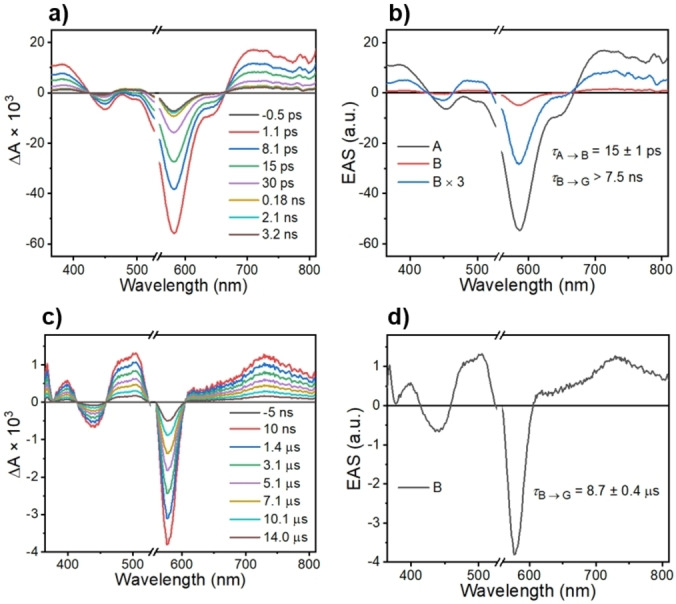
Figure 3.

FsTA (a) and nsTA (c) spectra of 1 in toluene at 295 K at selected times following a 150 fs, 545 nm excitation pulse. b) and d) are the corresponding evolution‐associated spectra of 1 with kinetic values. Species A is assigned to 1*tpPDI‐2BDPA‐d 16, while the long‐lived intermediate B has absorption features of triplet tpPDI. G is the ground state.
