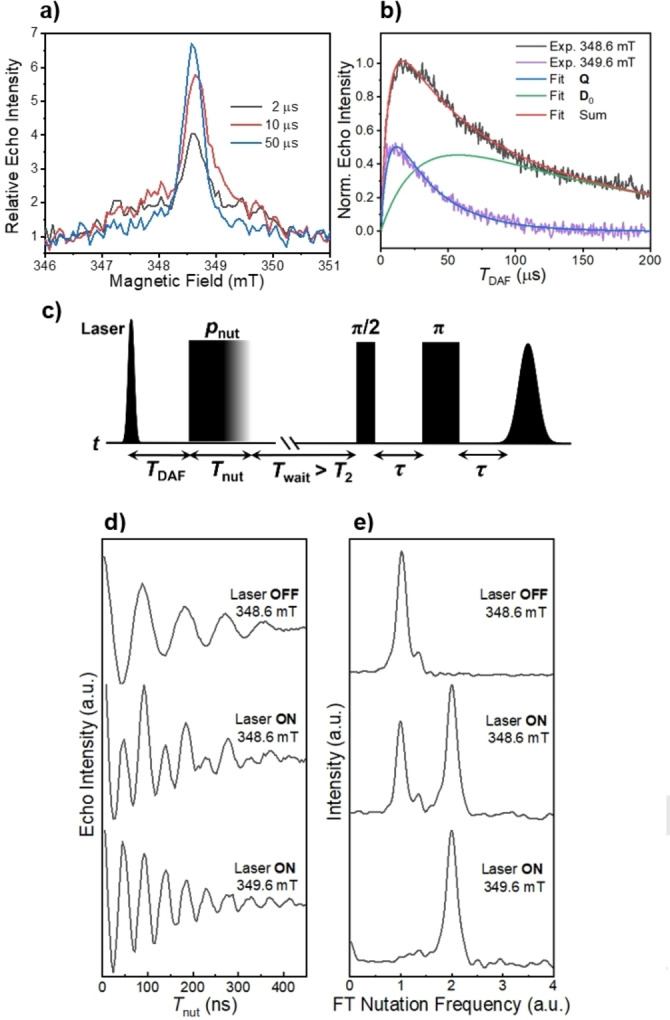
Figure 5.

a) Three time slices of EDFS spectra of 1 obtained in mTHF at 85 K at varying time delays T DAF, ratioed to the dark background spectrum. b) Time evolution of the amplitude following laser excitation at two field positions. Superimposed are the spectral fits. c) Pulse sequence of nutation experiments. d) Normalized echo intensities collected versus the nutation pulse length T nut with and without laser excitation at different magnetic field positions (348.6 mT and 349.6 mT) and e) their corresponding Fourier‐transformed results normalized by the nutation frequency of the ground doublet state in the dark.
