
Figure 3.
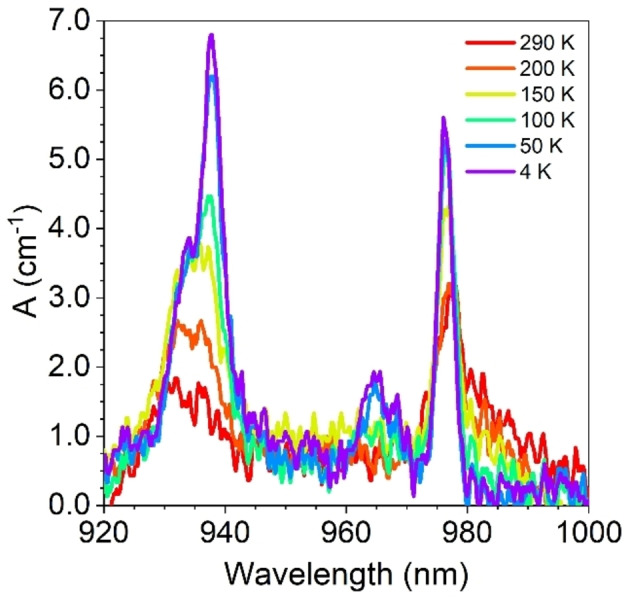
Temperature variation (selected temperature, see legend) of the absorption spectrum (920–1000 nm) for a single crystal of (P)‐2 measured with the unpolarized light wavevector propagating along the c crystallographic axis.
Official websites use .gov
A
.gov website belongs to an official
government organization in the United States.
Secure .gov websites use HTTPS
A lock (
) or https:// means you've safely
connected to the .gov website. Share sensitive
information only on official, secure websites.
Temperature variation (selected temperature, see legend) of the absorption spectrum (920–1000 nm) for a single crystal of (P)‐2 measured with the unpolarized light wavevector propagating along the c crystallographic axis.