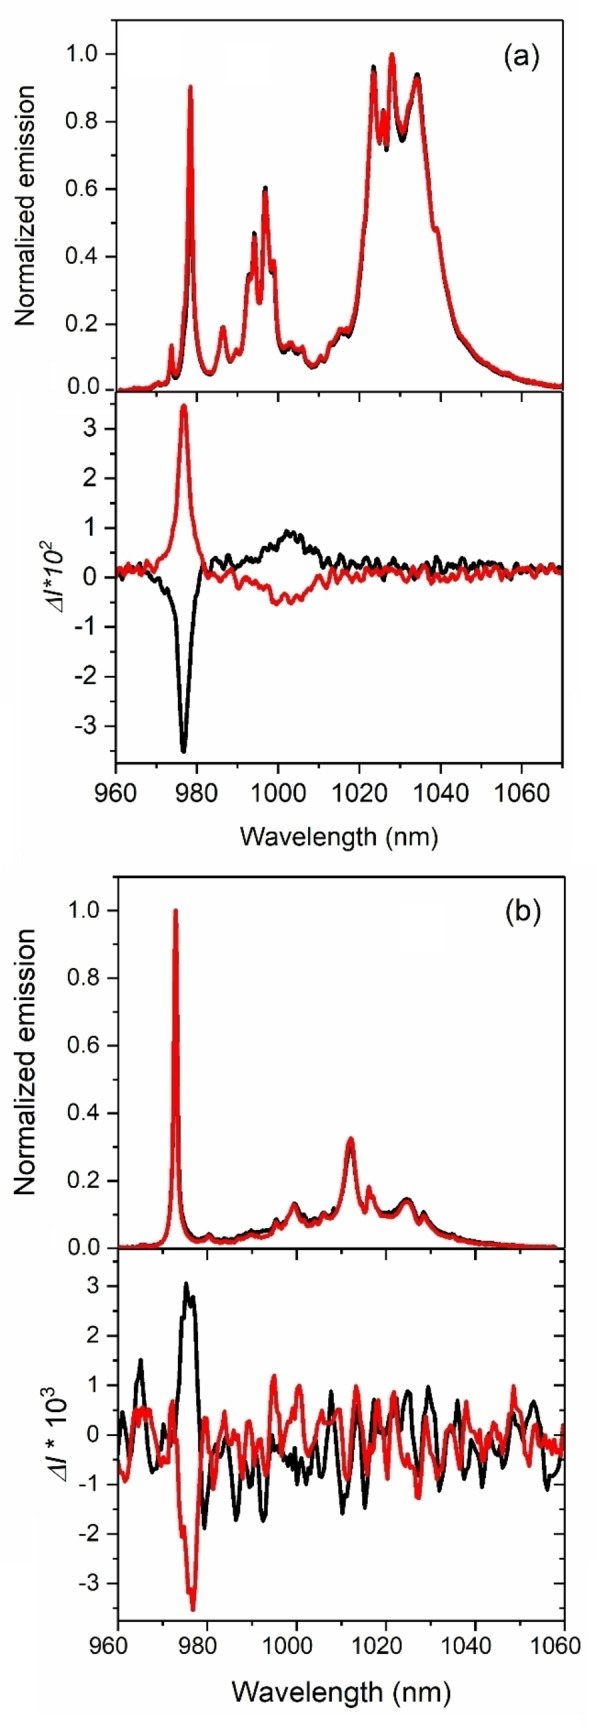
Figure 4.

Total luminescence (at 77 K) (top) and CPL (at 298 K) (bottom) spectra, under 365 nm excitation of 1 (a) and 2 (b) in solid state. The scales luminescence and CPL are normalized to the maximum of emission. Spectra for P and M enantiomers are shown in red and black, respectively.
