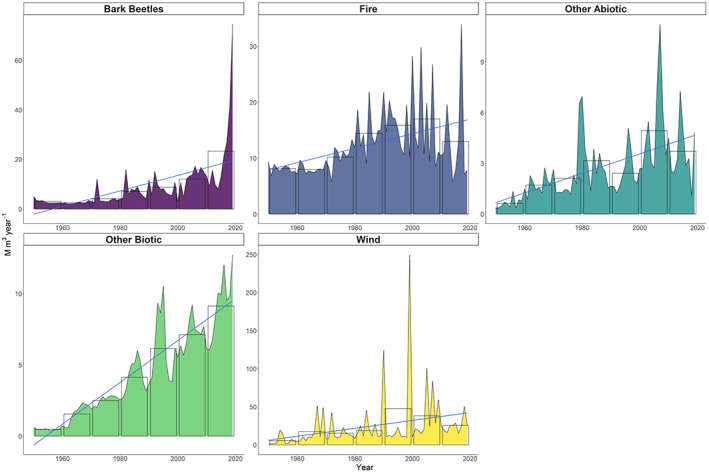
FIGURE 5.

Expert's interpreted gap‐filled time‐series of disturbance drivers between 1950 and 2019. The values represent the sum of the 34 European countries object of this study. The bars represent a decadal average. The lines are linear models fitted to the decadal averages. The scales of the panel's y‐axis differ for improving the visualization.
