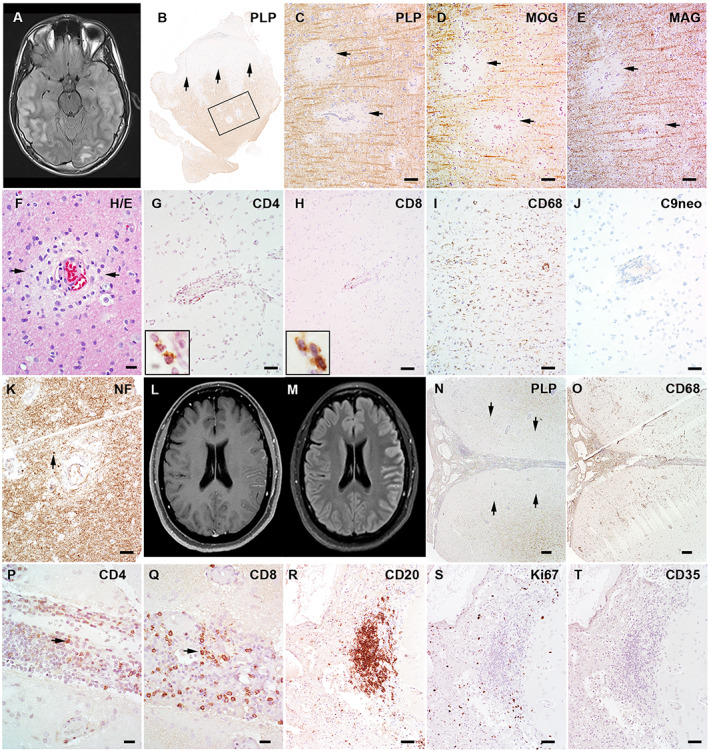
FIGURE 1.

The magnetic resonance imaging (MRI) and pathology of 2 patients with myelin oligodendrocyte glycoprotein (MOG) antibody‐associated disease cerebral cortical encephalitis. (A–K) Patient 12 (Table S1). (A) The axial MRI fluid‐attenuated inversion recovery (FLAIR) image shows swelling and T2 hyperintensity in the right more than left cortex and in subcortical white matter. (B) Cortical biopsy of the right temporal lobe in this patient shows diffuse subpial cortical demyelination (arrows) and small perivascular intracortical demyelination within the frame (proteolipid protein [PLP] immunohistochemistry). (C–E) The enlarged views of framed region in B show perivascular myelin loss to an equal extent in PLP (C), MOG (D), and myelin‐associated glycoprotein (MAG; E). (F) Hematoxylin and eosin (H&E) stain shows mild perivascular infiltration and edema. (G, H) Immunohistochemistry reveals perivascular infiltration of both CD4+ (G) and CD8+ (H) T lymphocytes. (I) Extensive microglial reactions are present beyond the demyelination in the cortex. (J) No C9 neoantigen (terminal complement activation product) is present. (K) Axons are preserved with mild perivascular spheroid formation (indicated with arrow). (L–Q) Patient 18 (Table S1). (L) Axial T1‐weighted postgadolinium MRI shows cortical and leptomeningeal enhancement. (M) Axial FLAIR images reveal cortical T2 hyperintensity and swelling in the left hemispheric cortex. (N) Left hemispheric cortical biopsy using the PLP stain shows extensive subpial cortical demyelination (indicated with arrows) with marked meningeal inflammatory infiltration. (O) CD68 stain highlights extensive macrophage/microglial reactivity in both meninges and subpial lesions. (P, Q) CD4+ (P) and CD8+ (Q) lymphocytes are both present in the subarachnoid space. (R) CD20 immunohistochemistry shows B‐cell abundant aggregates present in the leptomeninges. (S) The staining for the proliferation marker, Ki67, reveals no proliferating activity in the B‐cell aggregates. (T) CD35 immunohistochemistry shows absence of follicle dendritic cells. Scale bars: 100μm (C–E, I, K), 20μm (F, P, Q), 50μm (G, H, J, R‐T), 200μm (N, O). [Color figure can be viewed at www.annalsofneurology.org]
