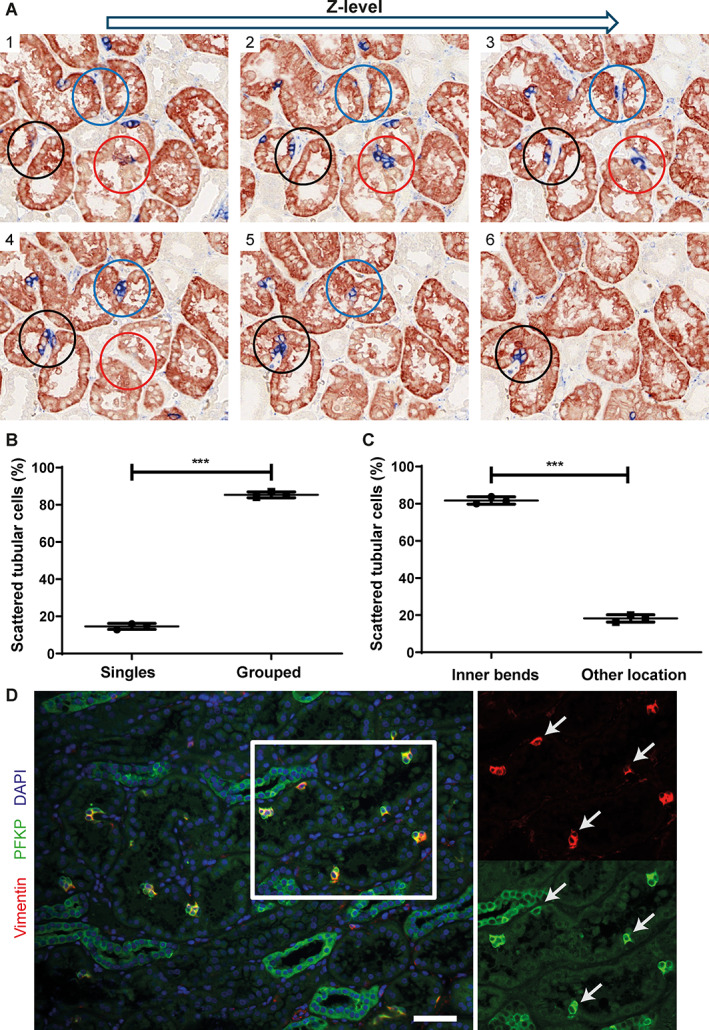
Figure 1.

STCs are mainly present in groups located at the inner bends of the proximal tubule. (A) Immunohistochemistry staining for AQP‐1 (red) as PTEC marker and vimentin (blue) as STC marker. Microscopic images 1–6 show staining of serial slides of 2 μm from high z‐plane (image 1) to low z‐plane (image 6). The blue, black, and red circles show areas in which STCs can be detected in groups located at inner bends of the proximal tubule. Manual scoring of the STCs was performed in three different normal human tissues for 10 randomly chosen cortex areas of 20 z‐planes of serial slides per kidney. See supplementary material, Video S1, for a 3D reconstruction. (B) Percentage of STCs present as single cells or in groups of more than two cells in each normal human kidney. (C) Percentage of STCs at inner bends of proximal tubule and located elsewhere inside proximal tubule in each normal human kidney. (D) Immunofluorescence staining of normal human kidney for vimentin (red) and PFKP (green). STCs show co‐expression of both markers (white arrows). Scale bar: 50 μm. ***p < 0.0001, unpaired two‐tailed t‐test. AQP‐1, aquaporin‐1; PTEC, proximal tubule epithelial cell; STC, scattered tubular cell; PFKP, phosphofructokinase‐platelet.
