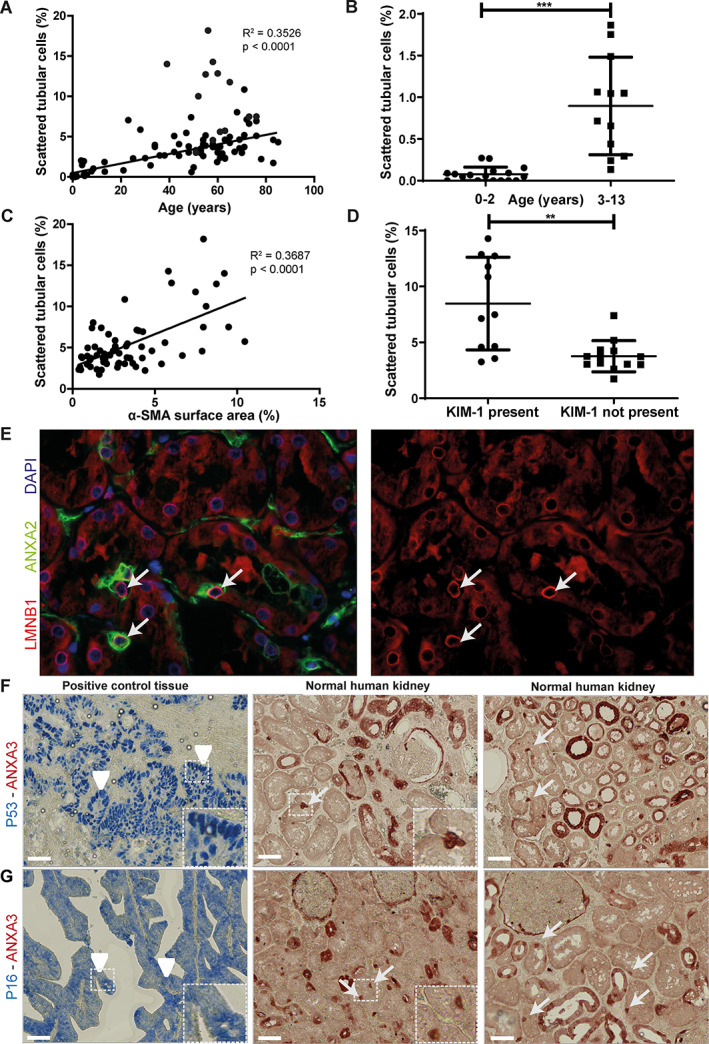
Figure 2.

STC number increases in renal aging and injury but cannot be associated with cellular senescence. (A) Regression analysis of STC number versus age in normal human kidney tissue from tumor nephrectomies using the unaffected pole of 37 patients (48–85 years), 29 renal transplant biopsies from donor kidneys prior to transplantation (age 23–76) and 41 kidney tissues obtained from autopsy (age 0–61 years). (B) STC numbers in children aged 0–13. Children aged 0–2 years show mean 0.076 ± SD 0.09 STCs (N = 17), those aged 3–13 years show mean 0.90 ± SD 0.59, (N = 12). (C) Regression analysis of STC number and α‐SMA expression surface area in normal human kidneys from tumor nephrectomy. (D) Relationship between KIM‐1 and number of STCs in normal human kidney tissue derived from tumor nephrectomy. (E) Representative immunofluorescence LMNB1 (red) and STC marker ANXA2 (green). A normal to high level of LMNB1 around the nucleus (blue, DAPI staining) is found in STCs (arrow). (F) Immunohistochemistry for p53 (blue) and ANXA3 (red). Arrowheads show p53 in positive control tissue, arrows indicate STCs. (G) p16 immunohistochemistry (blue) and ANXA3 (red). Arrowheads indicate positive control tissue, and arrows show STCs in normal human kidneys. Scale bar: (F and G) 50 μm. **p < 0.001, ***p < 0.0001. STC, scattered tubular cell; α‐SMA, alpha‐smooth muscle actin; KIM‐1, kidney injury molecule‐1; LMNB1, lamin B1; ANXA2, annexin A2; ANXA3, annexin A3.
