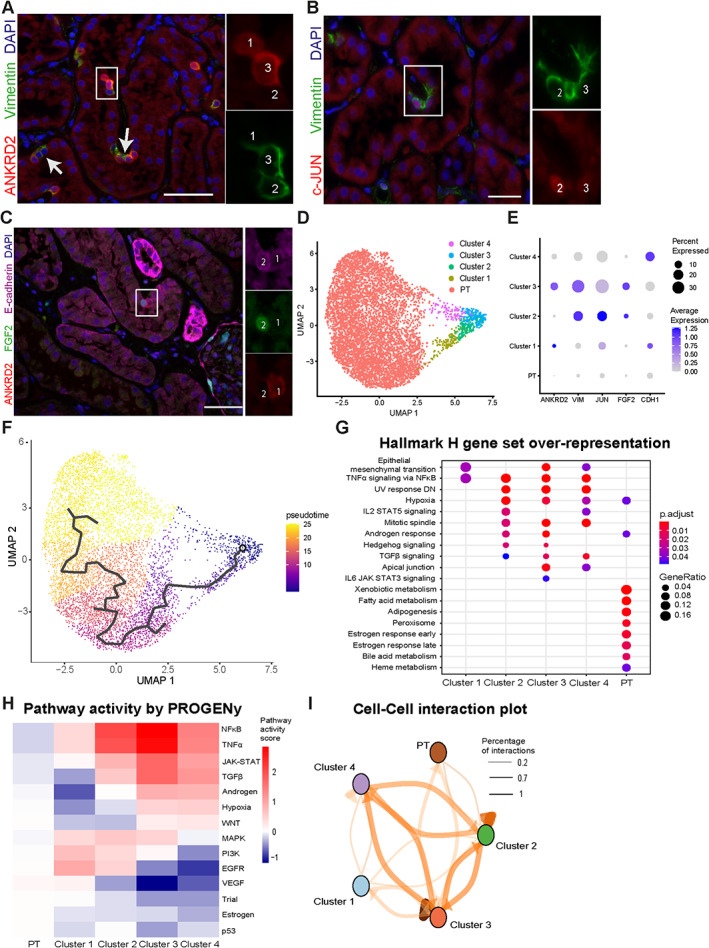
Figure 5.

Single‐cell sequencing identifies multiple cell clusters that resemble STCs in normal human kidney. (A) Immunofluorescence staining for ANKRD2 (red) and vimentin (green). Cell 1 shows expression of ANKRD2 but not vimentin, whereas in Cell 2 vimentin is expressed but ANKRD2 is not. Both ANKRD2 and vimentin are detected in Cell 3. (B) Similar heterogeneity was observed for c‐JUN (red) and vimentin (green) and for (C) ANKRD2 (red), FGF2 (green), and E‐cadherin (magenta). (D) Isolated proximal tubule cluster with four subclusters of proximal tubule cells expressing VCAM1 from an online dataset. (E) Dot plot of gene expression of immunofluorescent markers in (A–C). The clusters to which the cells belong are indicated in the immunofluorescent images, and, except for E‐cadherin, all other heterogeneous expression patterns are also observed in the single‐cell RNA sequencing dataset. (F) Pseudotime trajectory in isolated proximal tubules and VCAM1+ proximal tubule clusters as determined by Monocle. (G) Comparative overrepresentation analysis using Hallmark H gene sets from MSigDB for proximal tubule cells and PT_VCAM1 clusters. (H) Pathway activity per cell cluster using PROGENy. (I) Cell–cell interaction plot to visualize amount of ligand–receptor interactions between clusters. Line thickness reflects amount of ligand–receptor interactions. Scale bars: (A–C) 50 μm. ANKRD2, ankyrin repeat domain 2; FGF2, fibroblast growth factor 2; MSigDB, molecular signature database; STC, scattered tubular cell.
