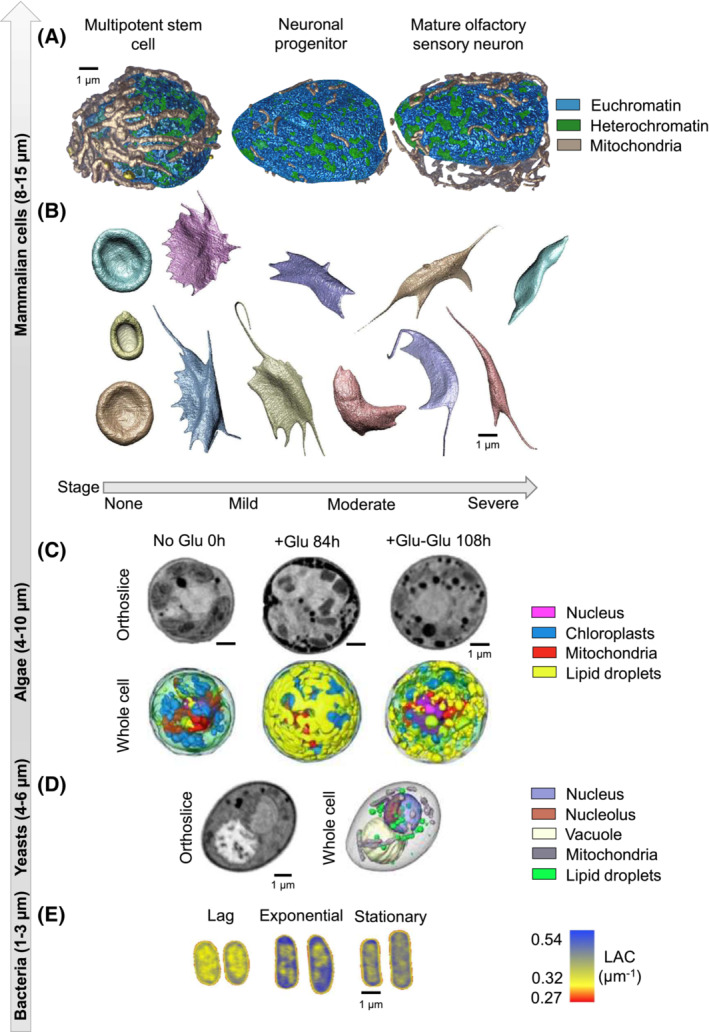
FIGURE 3.

Different cell types visualized by SXT. (A) Changes in nuclear organization of mouse olfactory epithelial cells (multi‐potent stem cell, neuronal progenitor, mature olfactory sensory neuron). 70 (B) Morphological changes in sickled blood cells at different stages of the disease. 57 (C) Changes in the ultrastructure and organization of the green alga, Chromochloris zofingiensis, after different timepoints after glucose stimulation and reversal 71 ; (D) organization of Saccharomyces cerevisiae 72 ; and (E) alterations in nucleoid compaction in Escherichia coli 73 at different stages of cell growth (lag, exponential, and stationary). Scale bar 1 μm.
