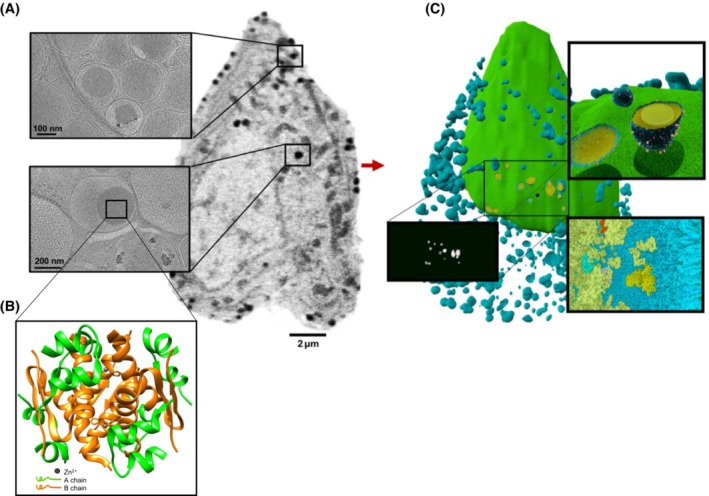
FIGURE 4.

Data integration for a comprehensive whole‐cell model of pancreatic beta cells (from White et al., 2020 38 ©, some rights reserved; exclusive licensee AAAS; distributed under a CC BY‐NC 4.0 License (http://creativecommons.org/licenses/by‐nc/4.0/). (A) Imaging data from SXT 38 and cryo‐ET 94 of INS‐1 E rat insulinoma pancreatic beta cells showing details of information at different spatial scales. (B) Structural features of the insulin crystal of cells (insulin structural model 95 ; PDB ID: 2OM0). (C) Model of the cell produced in CellPack (http://cellPACK.org/), based on information from (A) and (B).
