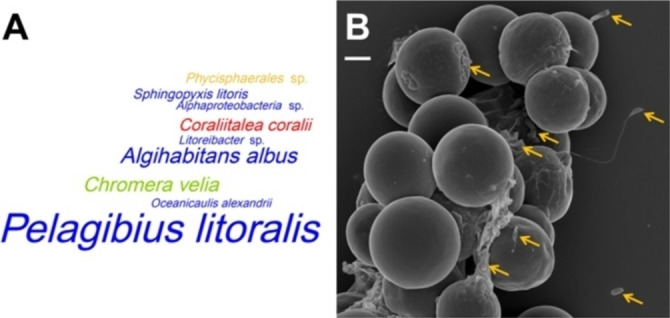
Figure 1.

Distribution of the most abundant heterotrophic bacteria in the phycosphere of C. velia CCAP 1602/1. A) Word cloud of metagenomic bacterial bins with a completeness of >50 %. The size of the taxon names corresponds to the genome coverage of the respective bins; the coverage of the eukaryotic algae was inferred from partial bins (Table S2). The following colour code was used to distinguish between the most abundant lineages on phylum/class level: green‐Chromerida, blue‐Alphaproteobacteria, red‐Flavobacteriia, yellow‐Planctomycetes. B) Scanning electron microscopy of C. velia; scale bar: 2 μm. Some rod‐shaped, coccoid and stalked bacteria are highlighted by orange arrows (photo courtesy of Manfred Rohde).
