FIGURE 2.

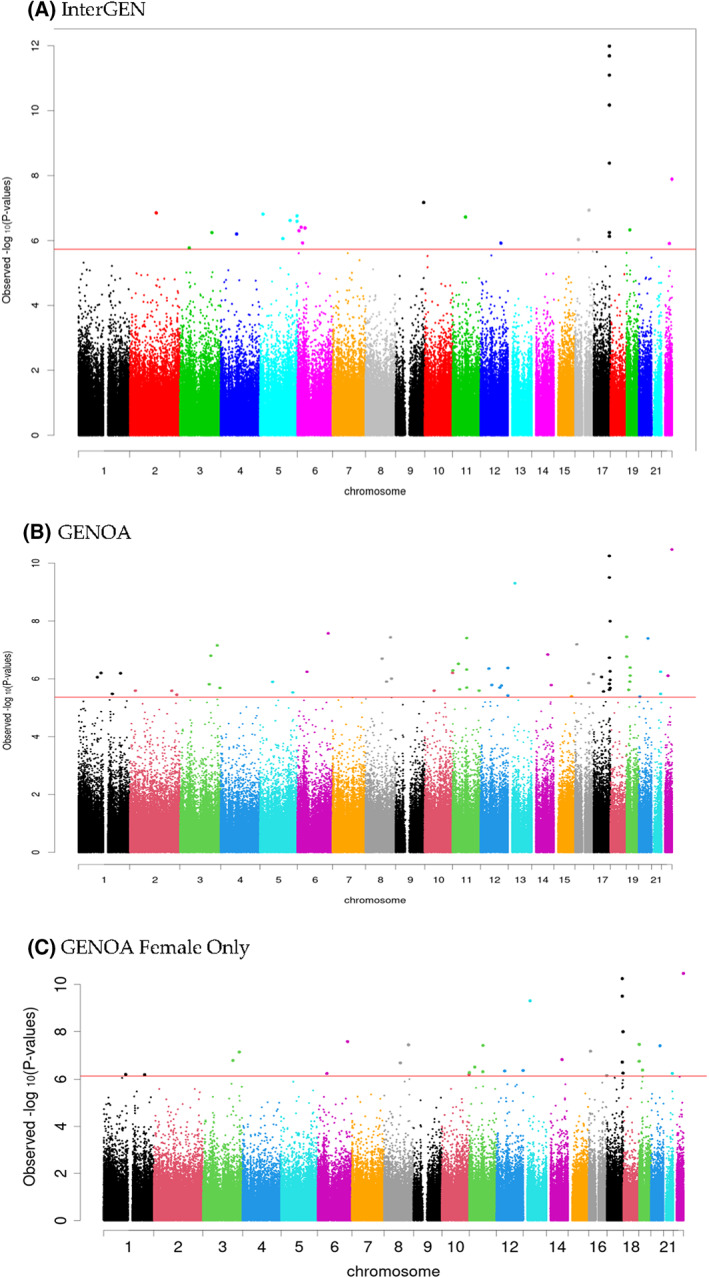
Manhattan plot of InterGEN and GENOA BMI EWAS. EWAS, epigenome‐wide association study [Color figure can be viewed at wileyonlinelibrary.com]

Manhattan plot of InterGEN and GENOA BMI EWAS. EWAS, epigenome‐wide association study [Color figure can be viewed at wileyonlinelibrary.com]