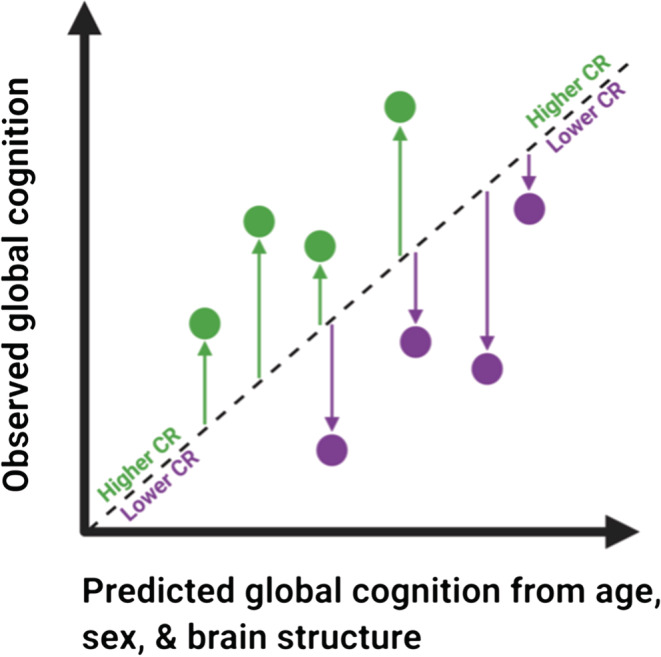
FIGURE 1.

Illustration of CR residuals from the regression of global cognition on age, sex, and brain structure. Positive residuals (green arrows) reflect better cognitive performance than expected given age, sex, and brain structure. Negative residuals (purple arrows) reflect poorer cognitive performance than expected. Higher/more positive residual values reflect higher CR. Image adapted with permission from Figure 1 (Franzmeier, Hartmann, et al., 2017)
