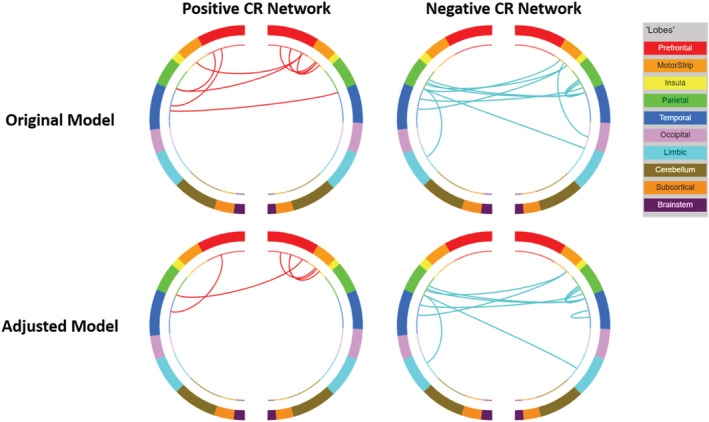
FIGURE 7.

Circle plots illustrating the positive and negative CR connectomes. Positive connections (red) and negative connections (blue) in original CPM (top panel) and adjusted CPM (bottom panel), controlling for age, sex, and mean FWD. These circle plots are inverted such that the right side of each plot corresponds to the left hemisphere and the left side to the right hemisphere.
