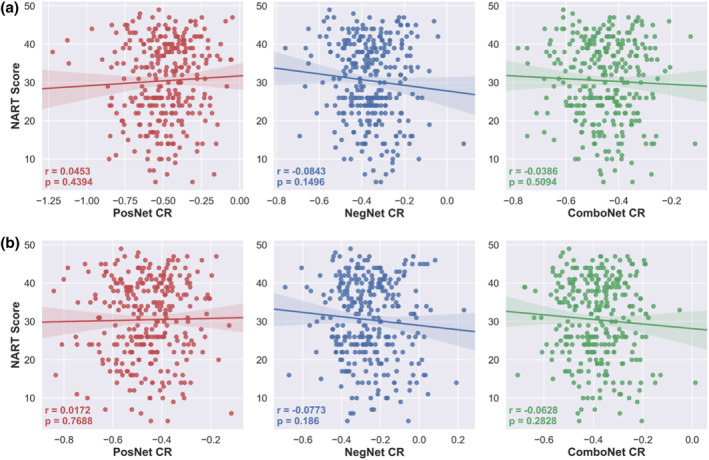
FIGURE 11.

NART scores versus positive‐, negative‐, and combined network strength predicted CR in the test set. a = predicted CR values from original network strength models; b = predicted CR values from adjusted network strength models, controlling for age, sex, and mean FWD
