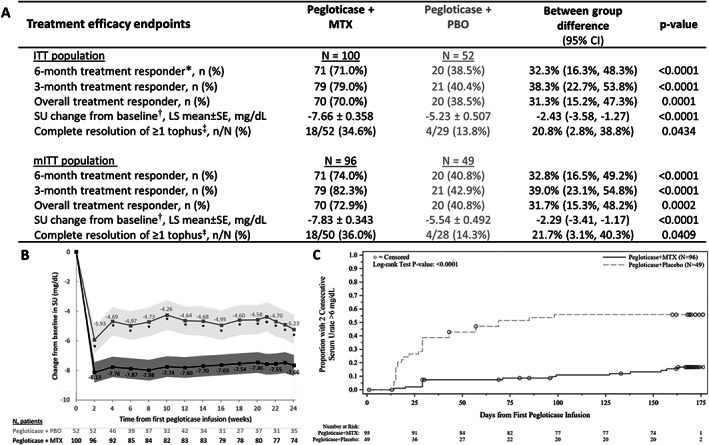
Figure 3.

A, Key treatment efficacy end points through week 24 in the intent‐to‐treat (ITT) and modified intent‐to‐treat (mITT) populations of patients randomized to receive pegloticase plus methotrexate (MTX) or pegloticase plus placebo (PBO) for treatment of uncontrolled gout. Treatment response was defined as serum urate (SU) <6 mg/dl for ≥80% of visits during month 6 (weeks 20–24). B, Least squares (LS) mean change from baseline in SU at each study visit. The shaded region represents 95% confidence intervals (95% CIs). C, Kaplan‐Meier curve for time to 2 consecutive SU measurements >6 mg/dl through week 24. Median time to 2 consecutive SU >6 mg/dl was not estimable in the pegloticase plus MTX group and 69 days (9.9 weeks) in the pegloticase plus PBO group (mITT population). In A, * = primary efficacy end point. † = determined through week 24 using mixed model repeated measures analysis. ‡ = assessed during pegloticase treatment; MTX/PBO was discontinued when pegloticase was discontinued. In B, asterisks denote a statistically significant difference between treatment groups (P ≤ 0.0001). In C, circles represent patient censoring due to 2 consecutive SU measurements >6 mg/dl.
