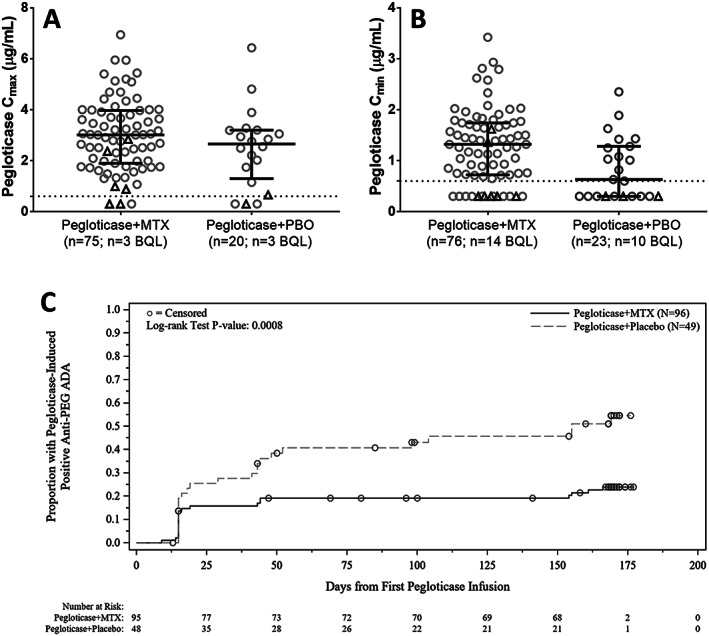
Figure 5.

Comparison of peak (Cmax [A]) and trough (Cmin [B]) concentrations of pegloticase at week 14 in patients who received cotreatment with methotrexate (MTX) or placebo (PBO). C, Kaplan‐Meier curve for time to anti–polyethylene glycol (anti‐PEG) IgG antibody positivity. Median time to anti‐PEG antibody positivity was not estimable in patients treated with pegloticase plus MTX and 155 days (lower quartile [Q1] 44, upper quartile [Q3] not estimable) in patients treated with pegloticase plus PBO. The below quantitation limit (BQL) was 0.6 μg/ml (imputed as 0.3 μg/ml in analysis). In A and B, circles represent treatment responders; triangles represent treatment nonresponders. Lines represent the median; whiskers represent Q1 and Q3. Dashed horizontal lines show the pegloticase BQL. In C, circles represent patient censoring. Numbers below the plot show the number of patients remaining in the analysis at each time point. ADA = antidrug antibody.
