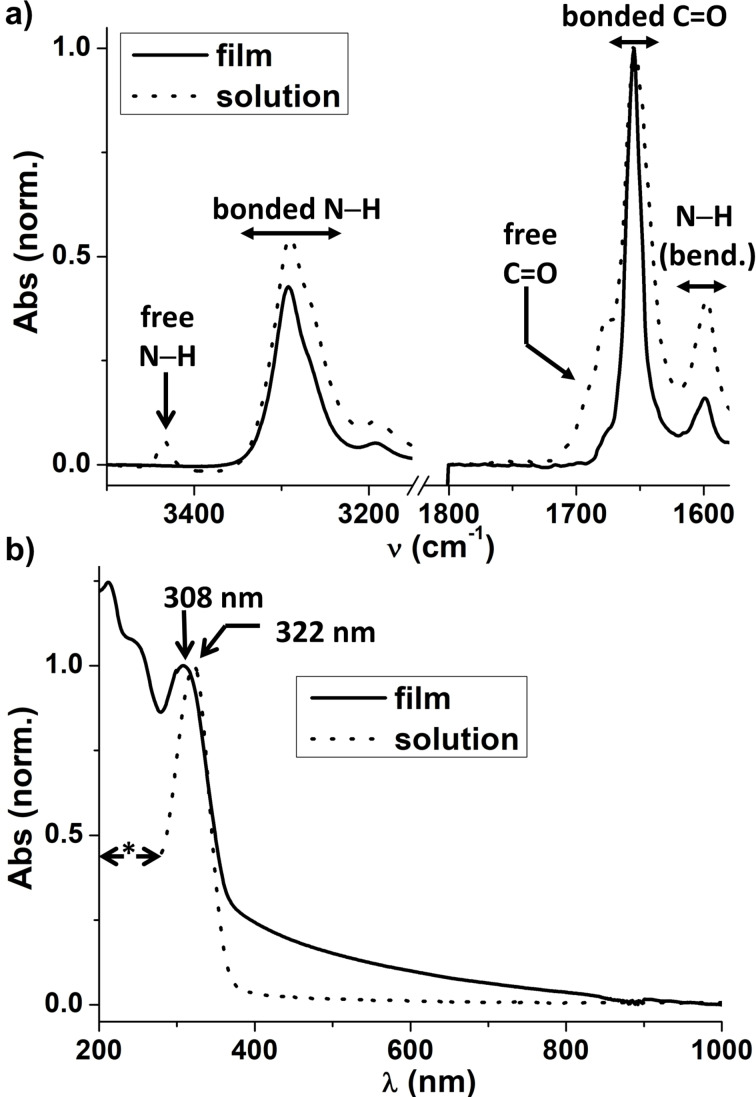
Figure 3.
Assemblies in absence of light (comparison of solution and solid states, 293 K). a) FTIR absorption spectra of TATA‐C12 in the solid (as film) and solution (22.3 mM in CHCl3) states. Normalized to the maximum of the band corresponding to bonded C=O (1655 cm−1). FTIR spectra of TATA‐C12 and TATA‐C13 are compared in Figure S4. b) UV‐Vis‐NIR absorption spectra of TATA‐C12 in the solid (as film) and solution (11.4 mM in CHCl3) states. Normalized to the maximum of the band at ca. 300 nm. The tail observed up to 800 nm in the film state is attributed to scattering. *: signal saturation.

