Figure 4.
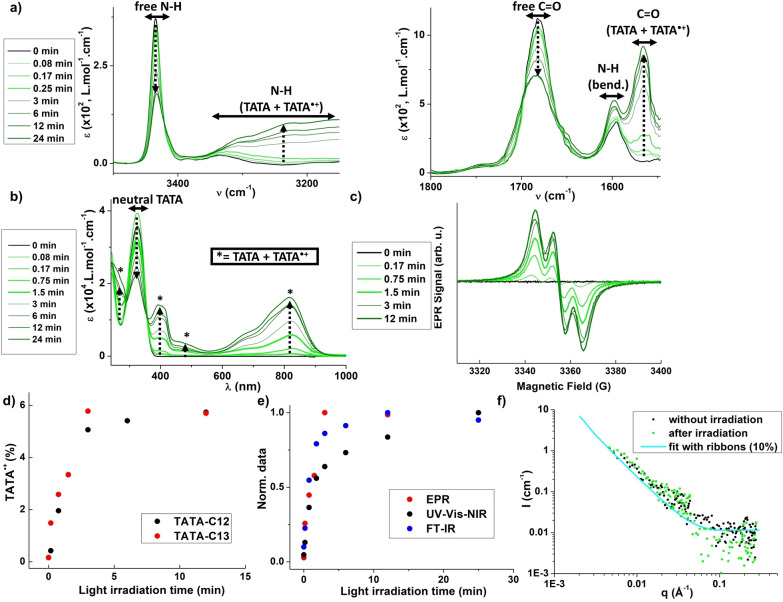
Assemblies in presence of light (intermediate regime, 2.3 mM solutions in CHCl3, 293 K). a) FTIR absorption spectra of TATA‐C12 solution before and after light irradiation (0–24 min), Zoom on the N−H region (left) and C=O regions (right). Arrows serve as a guide to the eyes for the evolution of the main bands upon increasing the irradiation time. b) UV‐Vis‐NIR absorption spectra of TATA‐C12 solution before and after light irradiation (0–24 min). Arrows serve as a guide to the eyes for the evolution of the main bands upon increasing the irradiation time. c) EPR spectra of TATA‐C12 solution before and after light irradiation (0–12 min), d) Amount of TATA⋅+ species (as quantified from EPR measurements) as a function of the irradiation time. e) Intensities of EPR data, FTIR data (band at 1566 cm−1), and UV–Vis–NIR data (signal at 818 nm) for TATA‐C12 normalized by their maximal intensity. f) SANS analyses of TATA‐C13 in CDCl3 before irradiation and ca. 7 h after being irradiated for 12 min. At least 1.5 % of radicals are present in the irradiated sample (Figure S7).

