Figure 5.
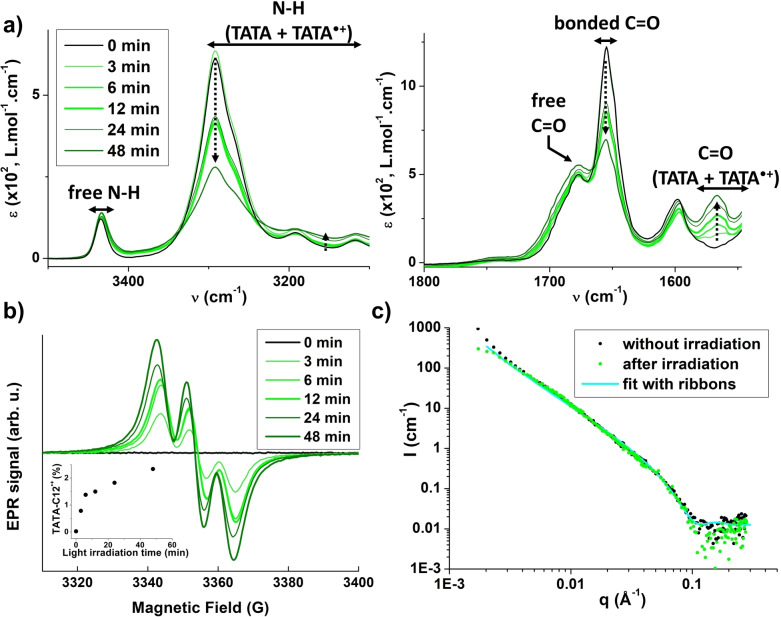
Assemblies in presence of light (concentrated solutions, 11.4 mM solutions in CHCl3, 293 K). a) FTIR absorption spectra of TATA‐C12 before and after light irradiation (0–48 min), Zoom on the N−H region (left) and C=O regions (right). Arrows serve as a guide to the eyes for the evolution of the main bands upon increasing the irradiation time. b) EPR spectra of TATA‐C12 solution before and after light irradiation (0–48 min), Inset: Amount of TATA‐C12⋅+ species as a function of the irradiation time. c) SANS analyses of TATAC13 in CDCl3 before irradiation and ca. 18 h after being irradiated for 12 min. At least 1.3 % of radicals are present in the sample (Figure S8c).

