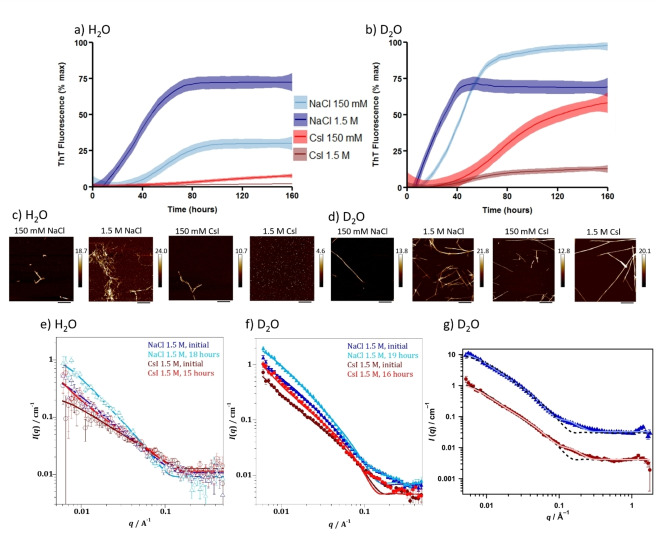
Figure 1.
NaCl and CsI concentrations influence αSyn aggregation rate and morphology. αSyn aggregation kinetics were measured in the presence of a) H2O and b) D2O with 150 mM NaCl (light blue), 1.5 M NaCl (navy), 150 mM CsI (red), 1.5 M CsI (brown) and plotted as % maximum ThT fluorescence over time (Figure S1 displays individual plate repeats). Data represent three experiments with three or four wells per condition per experiment; error (shaded areas) represents rolling average of the SEM. After the ThT‐based assays, αSyn was incubated on freshly cleaved mica and representative images are shown for αSyn species formed in the presence of NaCl and CsI at 150 mM and 1.5 M in c) H2O and d) D2O. Scale bar=800 nm. For SANS measurements a high concentration (434 μM) of αSyn was used to ensure a sufficient number of scatter counts were attained. Model fits to the SANS data, using a flexible cylinder model, of αSyn in 1.5 M CsI and NaCl in e) H2O and f) D2O after initial mixing (NaCl—dark blue, CsI—dark red) and incubation for 15–19 hours (NaCl—light blue, CsI—light red). g) Raw SANS data of αSyn in 1.5 M NaCl, 19 hours (blue triangles) and αSyn in 1.5 M CsI, 16 hours (red circles) with fittings to a flexible cylinder with spheres (pale blue or red filled line) described more accurately the data than fitting to a flexible cylinders model only (dashed black line) using data from αSyn in 1.5 M salts in D2O. The NaCl (blue) is offset by a factor of 10 for clarity.

