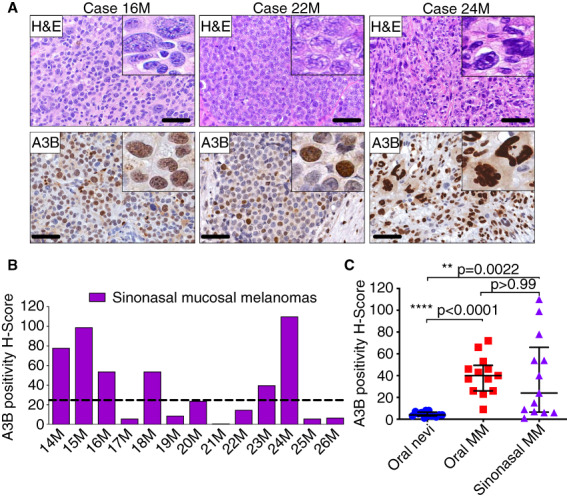
Figure 2.

Endogenous A3B protein expression in primary sinonasal MMs. (A) A3B staining and corresponding H&E‐stained photomicrographs of representative primary sinonasal MMs. Scale bars are 60 μm and inset images are magnified 8‐fold. (B) Collective presentation of quantified A3B H‐scores of sinonasal MMs (n = 13). The black horizontal dotted line indicates the A3B H‐score median (24) of this group. (C) Collective presentation and comparison of quantified A3B H‐scores of oral melanocytic nevi (n = 13), oral MMs (n = 13) and sinonasal MMs (n = 13). The H‐score median and interquartile range for each group are shown and statistical significance for key comparisons is indicated (Kruskal–Wallis test). [Color figure can be viewed at wileyonlinelibrary.com]
