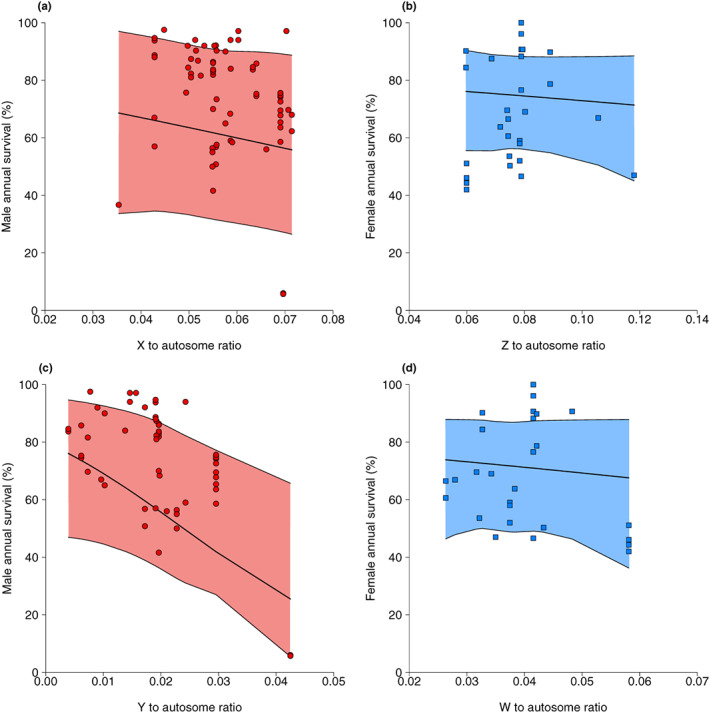
FIGURE 4.

Annual survival of the heterogametic sex in mammals (males, red circles) and birds (females, blue squares) vs. the sizes of the sex chromosomes relative to the autosomes. (a) Male survival vs. the relative size of X in mammals, (b) female survival vs. the relative size of Z in birds, (c) male survival vs. the relative size of Y in mammals, and (d) female survival vs. the relative size of W in birds. Each point is an annual survival estimate (multiple survival estimates per species are shown). Slopes and 95% credible intervals are estimated from phylogenetic mixed models run on untransformed data (see methods and Table S8).
