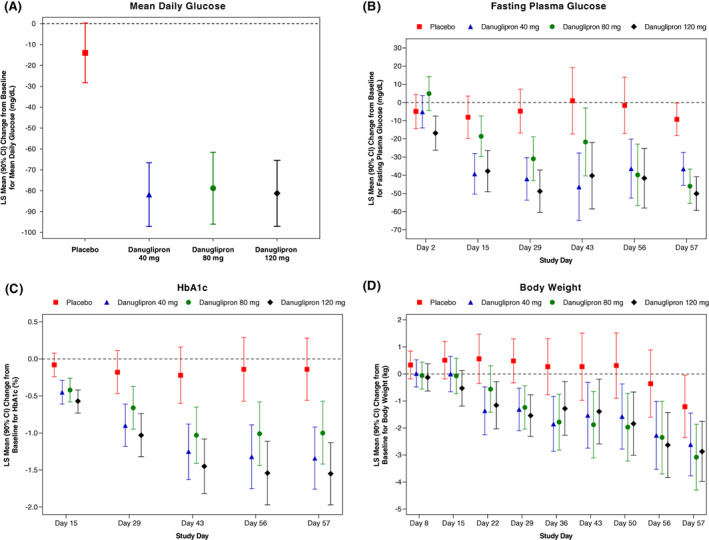
FIGURE 1.

LS‐mean change from baseline in A, MDG at Day 56, and B, FPG; C, HbA1c; and D, body weight over time, following twice‐daily oral dosing of danuglipron. Dose escalation, as shown in Figure S1 (Appendix S1), was utilized to achieve danuglipron target doses of 40, 80 and 120 mg twice daily. A, MDG was defined as glucose AUC24/24 h. For glucose at 24 h on Day −1 and 24 h on Day 56, glucose at 0 h on Day −1 and 0 h on Day 57 were used from the same participant, respectively. Values are LS‐mean (90% CI). From an ANCOVA model that included the change from baseline in MDG on Day 56 as the dependent variable, treatment as a fixed effect, and baseline MDG as a covariate. B‐D, Values are LS‐mean (90% CI). From an MMRM analysis that included treatment, baseline value, day, the baseline‐by‐day interaction, and the day‐by‐treatment interaction, with day fitted as a repeated effect and participant as a random effect. AUC24, area under the plasma concentration‐time curve from time 0 to 24 h; ANCOVA, analysis of covariance; CI, confidence interval; FPG, fasting plasma glucose; HbA1c, glycated haemoglobin; LS, least squares; MDG, mean daily glucose; MMRM, mixed model repeated measures
