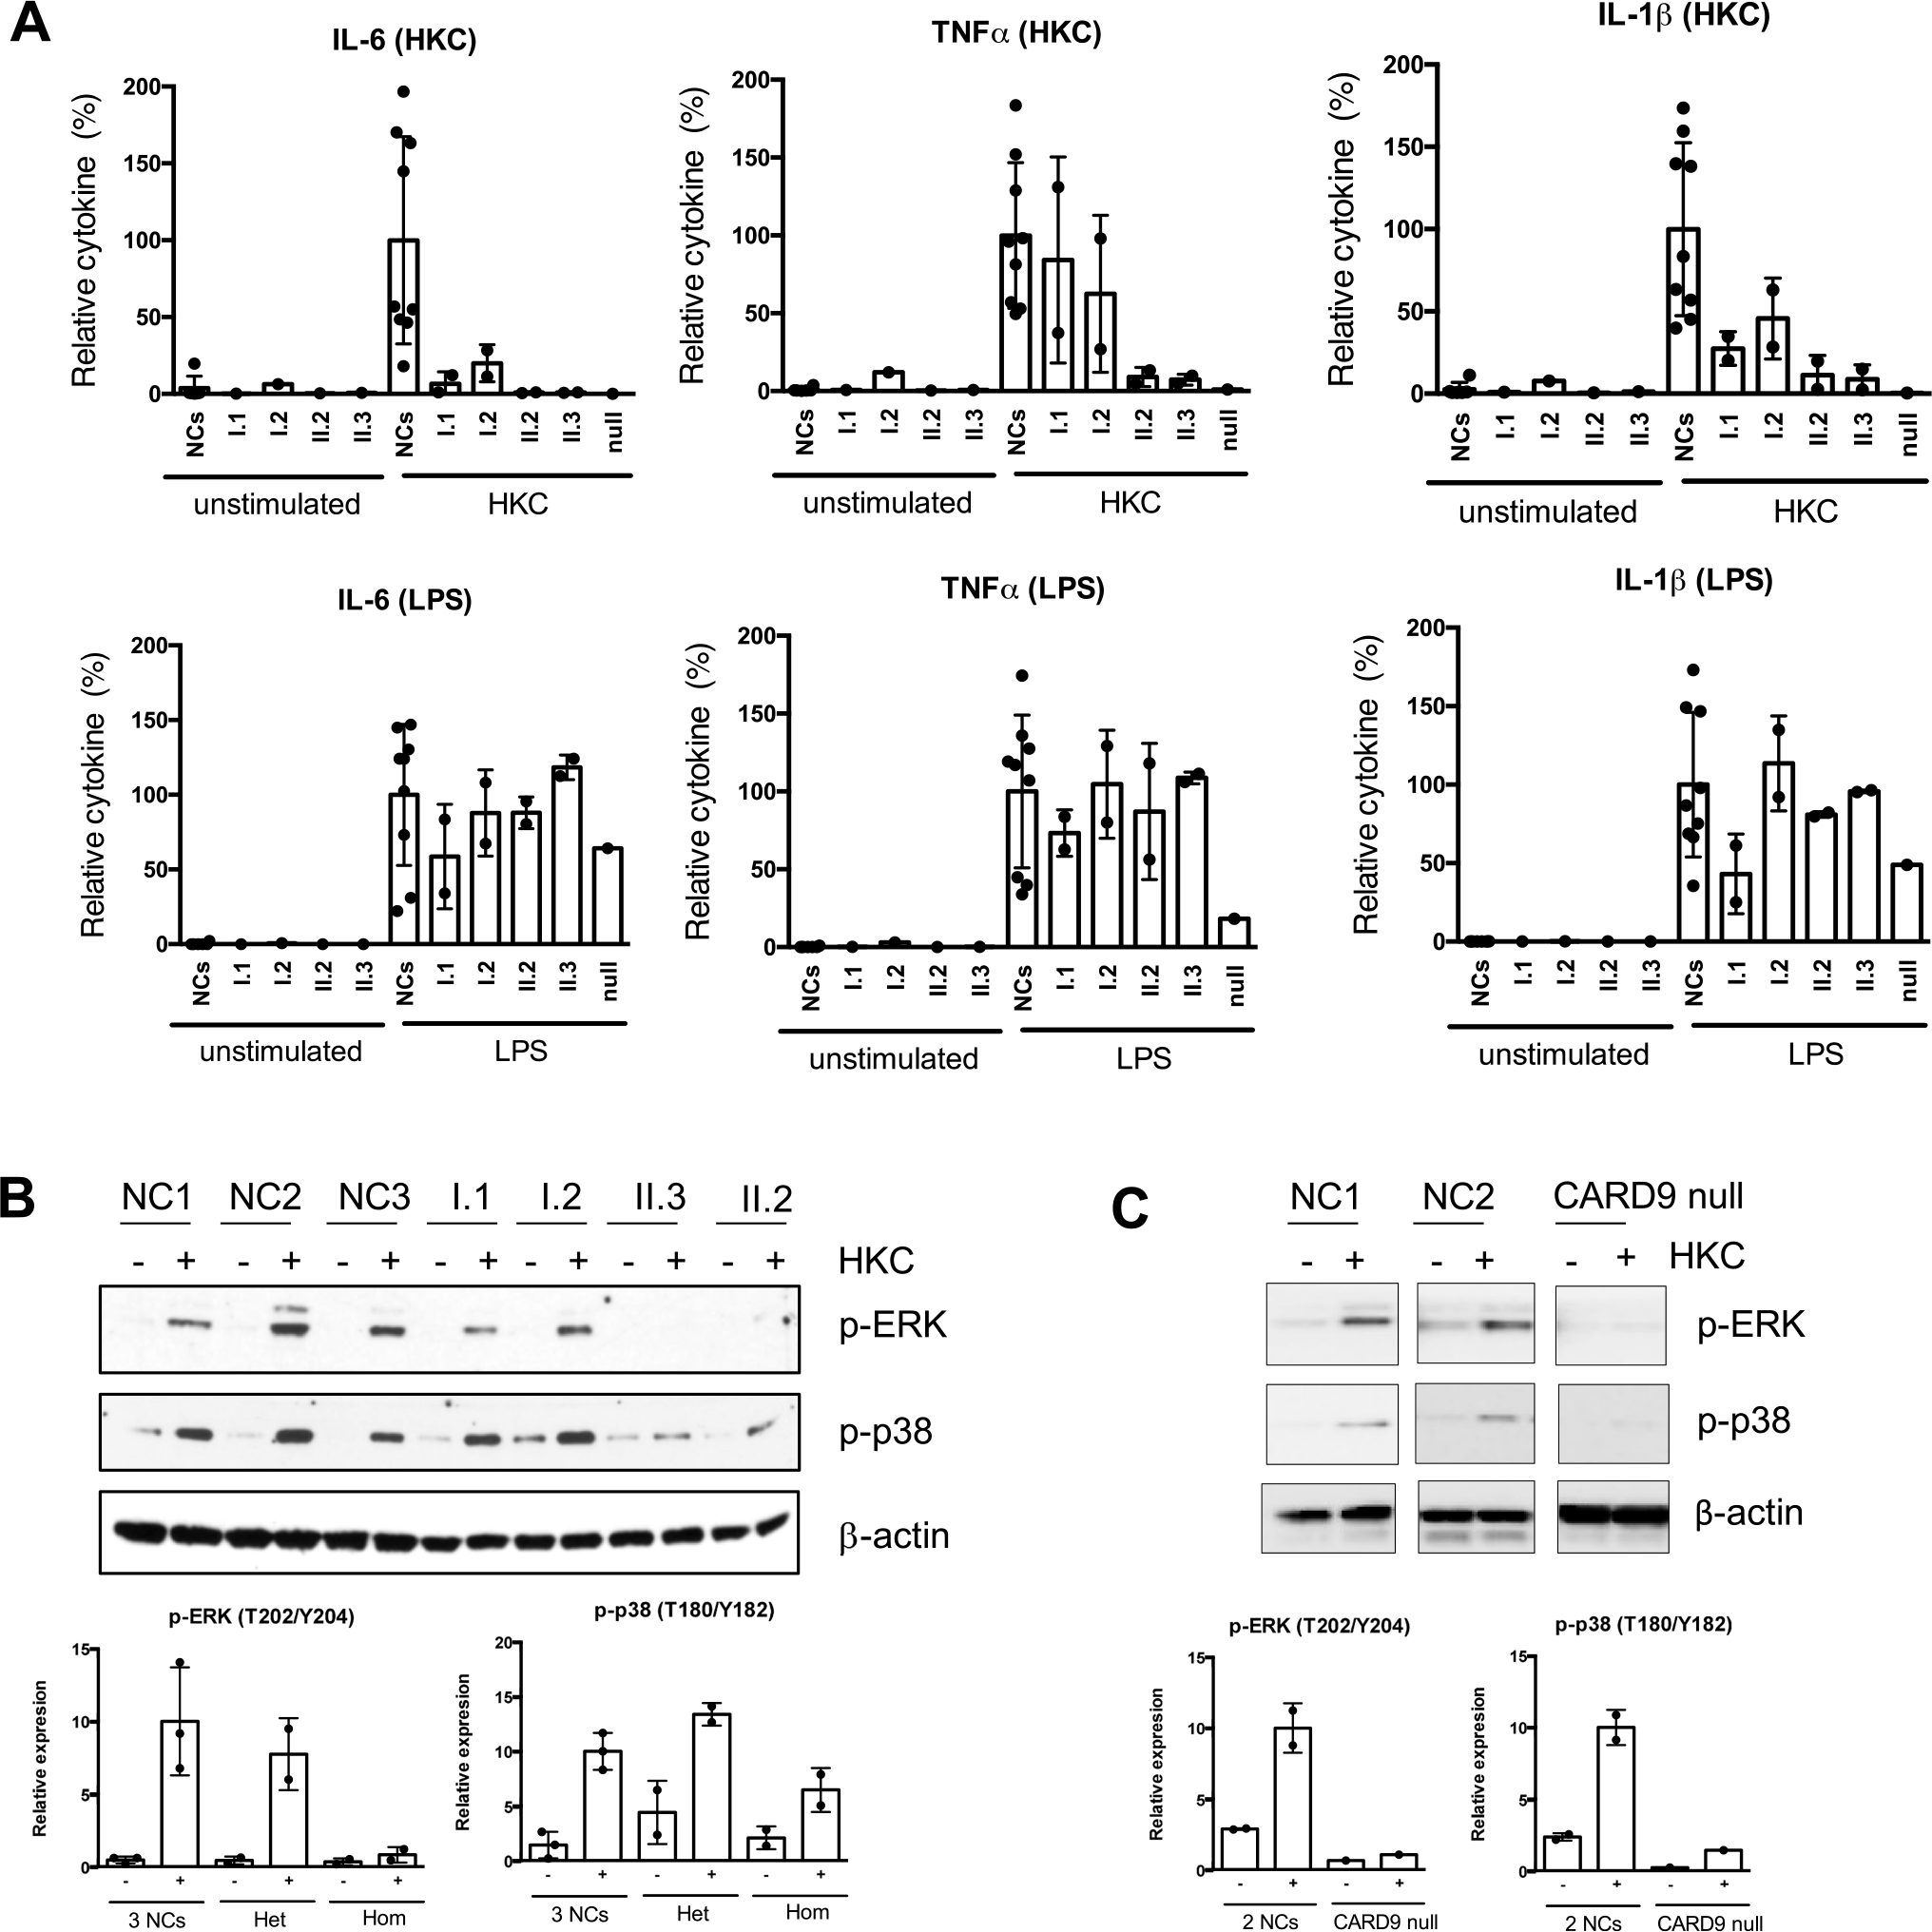
Fig. 3.

Cytokine generation and MAPK activation in patients with CARD9 mutations. A PBMCs from nine different normal controls and indicated patients were stimulated with HKC for 24 h. Supernatants were collected, and cytokines were tested by a multiplex Luminex kit. Data were pulled from two independent experiments and normalized each data set’s stimulated-normal controls to 100%. Data are plotted as mean ± SD. B, C Total PBMCs were stimulated with HKC for 60 min. Cell lysates were prepared and subjected to the western blot analysis with p-Erk and p-p38 antibodies. β-actin was used as a loading control. The p-ERK and p-p38 bands were quantified using densitometry, and the levels of protein were normalized to β-actin. The relative phosphorylation levels compared with the levels in normal controls are shown. The values are expressed as the mean ± SD from 2–3 normal controls and indicated groups (Het: heterozygous [I.1 and I.2], Hom: homozygous [II.2 and II.3]). A CARD9 null patient (p.Q289*/D8Afs*10) was included as a control to see the defect of CARD9-mediated signaling
